The ability to monitor your critical infrastructure is a must, and we designed the StreamSets Data Collector (SDC) with this in mind: metrics are exposed through both the REST API and JMX. While there are many approaches to monitoring these metrics, let’s walk through a specific end-to-end example using jmxtrans to collect metrics, InfluxDB to store them, and Grafana to visualize them.
We’ll use Docker to make things easy to set up in this demo environment, but you should follow each tool’s production-ready installation guides for a real deployment.
StreamSets Data Collector
The one prerequisite configuration for the Data Collector is that we enable JMX metrics and choose a port to listen on. We’ll use port 1105. This can be set by modifying the environment variable SDC_JAVA_OPTS and restarting the Data Collector. Let’s start an SDC instance with the following command.
docker run -d --name datacollector --expose 1105 -p 18630:18630 -e SDC_JAVA_OPTS="-Dcom.sun.management.jmxremote.port=1105 -Dcom.sun.management.jmxremote.authenticate=false -Dcom.sun.management.jmxremote.ssl=false" streamsets/datacollector:1.1.4
InfluxDB Setup
We’ve found a pretty good docker image for InfluxDB from the folks over at Tutum. In order to make sure that our data persists in the case we want to make changes to our InfluxDB container, we’ll first create a separate data-only container.
docker create --name influx-data -v /data tutum/influxdb:0.9
Next, we’ll start up our InfluxDB instance.
docker run -d \
--volumes-from influx-data \
-p 8083:8083 -p 8086:8086 --expose 2003 --expose 8084 \
-e PRE_CREATE=grafana \
-e GRAPHITE_DB="grafana" \
-e GRAPHITE_BINDING=':2003' \
-e GRAPHITE_PROTOCOL="tcp" \
--name influxdb \
tutum/influxdb:0.9
In the above command, we’re launching the InfluxDB container with the user-facing ports statically mapped to the host to keep things easy since this is a single-node installation. The InfluxDB web interface runs on 8083, 8086 has the REST API that Grafana will use for queries, and 2003 is the port for the Graphite protocol plugin for InfluxDB. This is important because jmxtrans (and the yaml2json converter) currently supports Graphite, but not the native InfluxDB interface.
The next set of options simply pre-create a database called ‘grafana’ and set up the Graphite protocol plugin.
Grafana
For Grafana, we’ll use the official docker image from the Grafana team. Starting this up is really simple; the only extra option we specify is a link to the InfluxDB container and an optional static port mapping.
docker run -d --link influxdb:influxdb -p 3000:3000 grafana/grafana:latest
jmxtrans
For running the JMX collector, we’ll use a pre-built docker image similar to InfluxDB and Grafana.
Rather than writing JSON configuration files manually, let’s use the YAML configuration option instead. The YAML configuration below is usable as-is, but for those curious, the full YAML documentation is available here.
You’ll need the yaml2jmxtrans.py script that is bundled with the jmxtrans distribution. You can download a zip or tarball from jmxtrans.org to obtain this script.
Download the example jmxtrans configuration file here. The ‘streamsets’ query will collect all of the StreamSets-specific mbeans exposed over JMX under the alias “streamsets”. The full example YAML configuration is shown below for context..
- name: streamsets
  obj : "metrics:name=sdc.pipeline.*"
  resultAlias: "streamsets"
  attr:
    - "Count"
    - "Max"
    - "Mean"
    - "Min"
    - "StdDev"
    - "Value"
    - "50thPercentile"
    - "75thPercentile"
    - "95thPercentile"
    - "98thPercentile"
    - "99thPercentile"
    - "999thPercentile"
    - "FiveMinuteRate"
    - "FifteenMinuteRate"
    - "MeanRate"
    - "OneMinuteRate"
Once you’ve defined a YAML configuration it needs to be converted into the JSON file that jmxtrans expects using the yaml2jmxtrans.py script (Python 2.6+ required). If your configuration file is called ‘jmxtrans.yml’ you can invoke it with:
<jmxtrans directory>/tools/yaml2jmxtrans.py jmxtrans.yml
You’ll have a JSON file called StreamSetsBase.json output in the current directory. We’ll mount this to the jmxtrans container as a volume.
Start jmxtrans with
docker run -d --name jmxtrans --link datacollector --link influxdb -e JMXTRANS_GRAPHITE_HOST=influxdb -e JMXTRANS_GRAPHITE_PORT=2003 -e JMXTRANS_JMX_HOST=datacollector -e JMXTRANS_JMXPORT=1105 -v $PWD/StreamSetsBase.json:/opt/jmxtrans/conf/StreamSetsBase.json kunickiaj/jmxtrans:latest
We should now have metrics flowing into InfluxDB and are ready to setup some dashboards!
Dashboards
You should now be able to browse over to http://<your grafana host>:3000 and login with the default username and password: admin / admin.
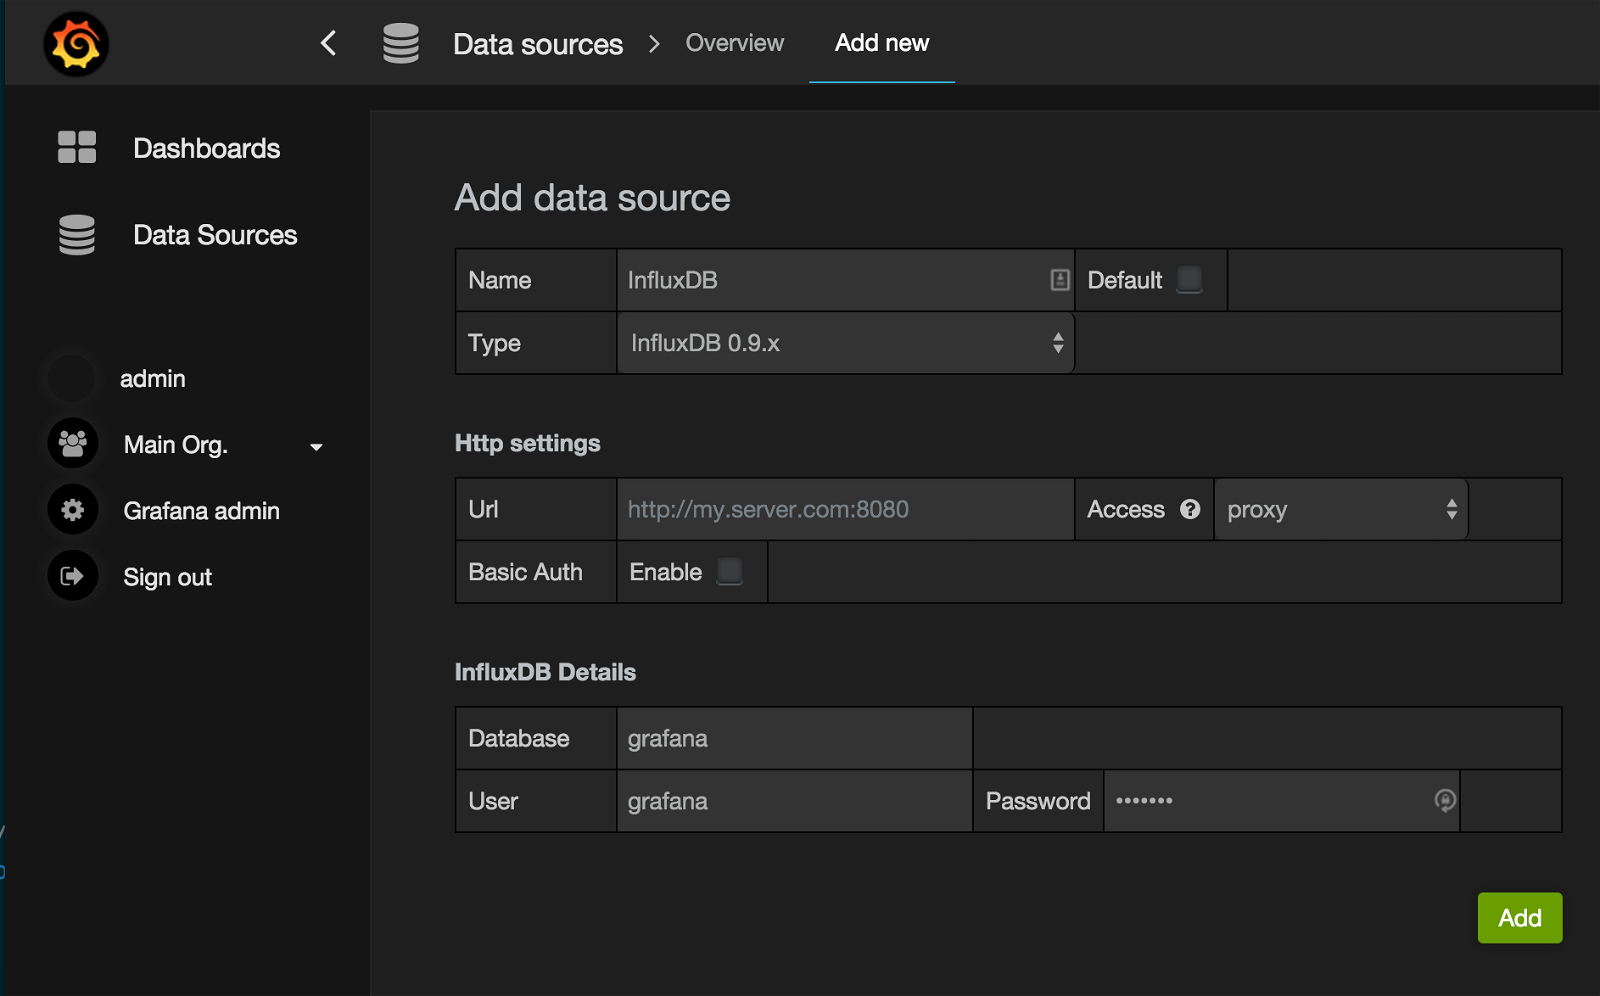
The first thing we need to do is tell Grafana about our InfluxDB data source.
Next, we will create a new dashboard by clicking on ‘Home’ in the Dashboard Selector and then New. This will create a new dashboard titled New Dashboard.
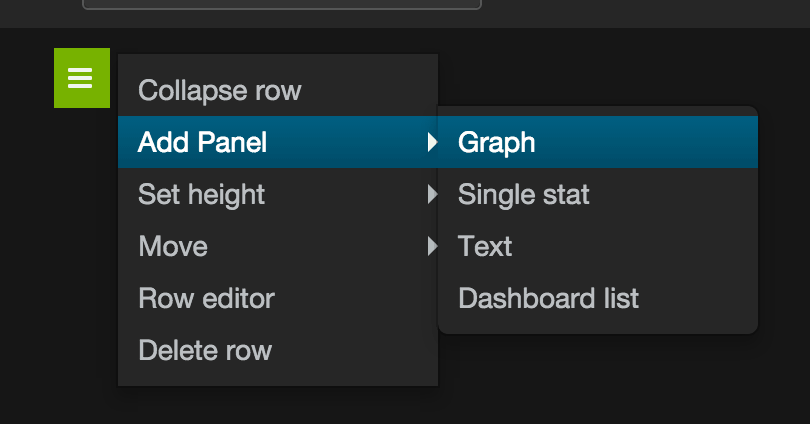
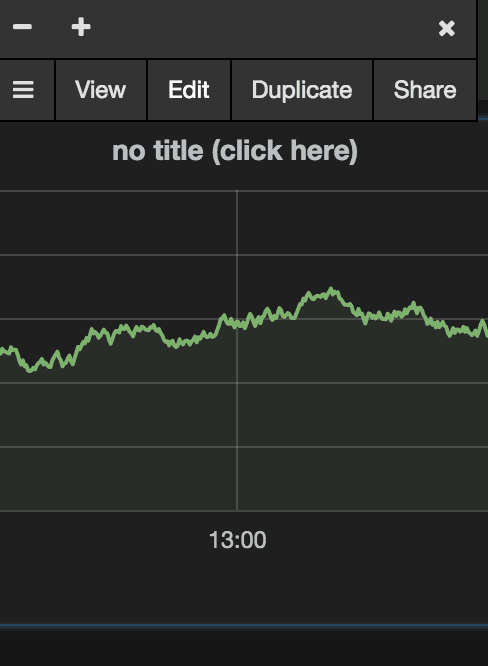
Now, click the green bar on the left hand side of the empty dashboard and choose Add Panel > Graph. This adds a new graph with some sample data. We’ll want to click the title bar of the graph and choose Edit to specify our own metrics from InfluxDB.
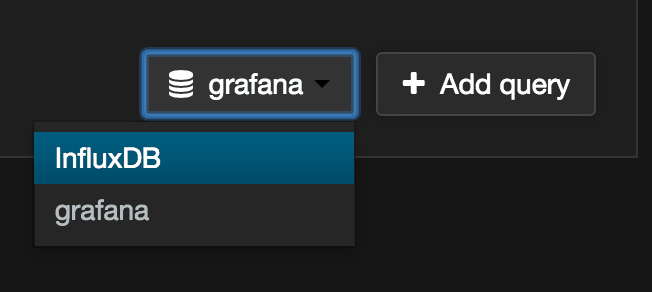
Now, change the data source from the default to ‘InfluxDB’
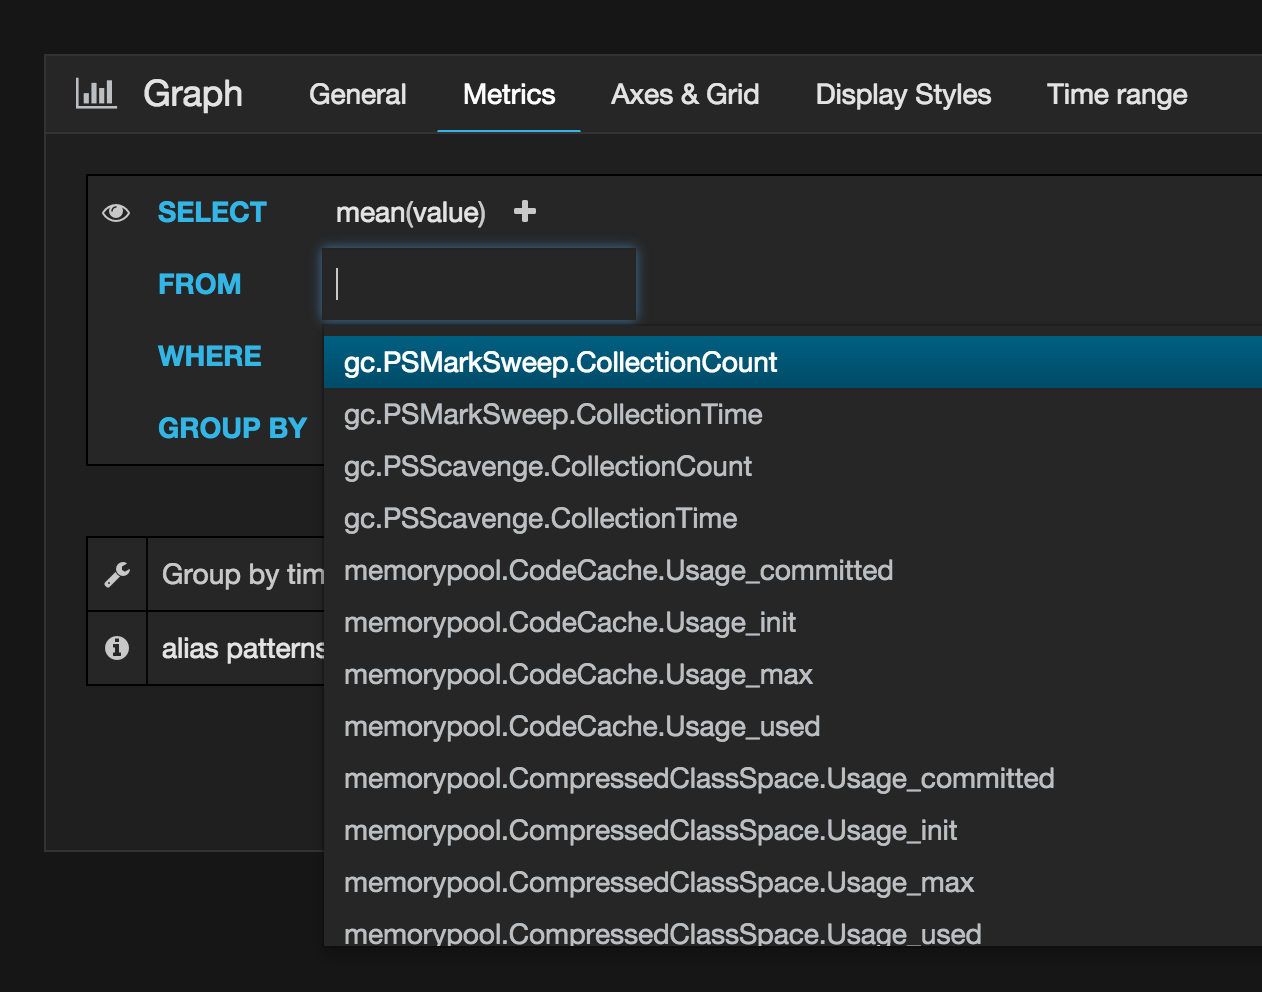
Configuring metrics. In the FROM box you can choose from an automatically populated list of metrics. Data Collector metrics will be prefixed with streamsets based on our jmxtrans configuration. Please note that until you’ve created a pipeline in StreamSets Data Collector and have started it, there won’t yet be any data available for Grafana to populate the autocomplete list. Create and start a pipeline first in order to display some metrics.
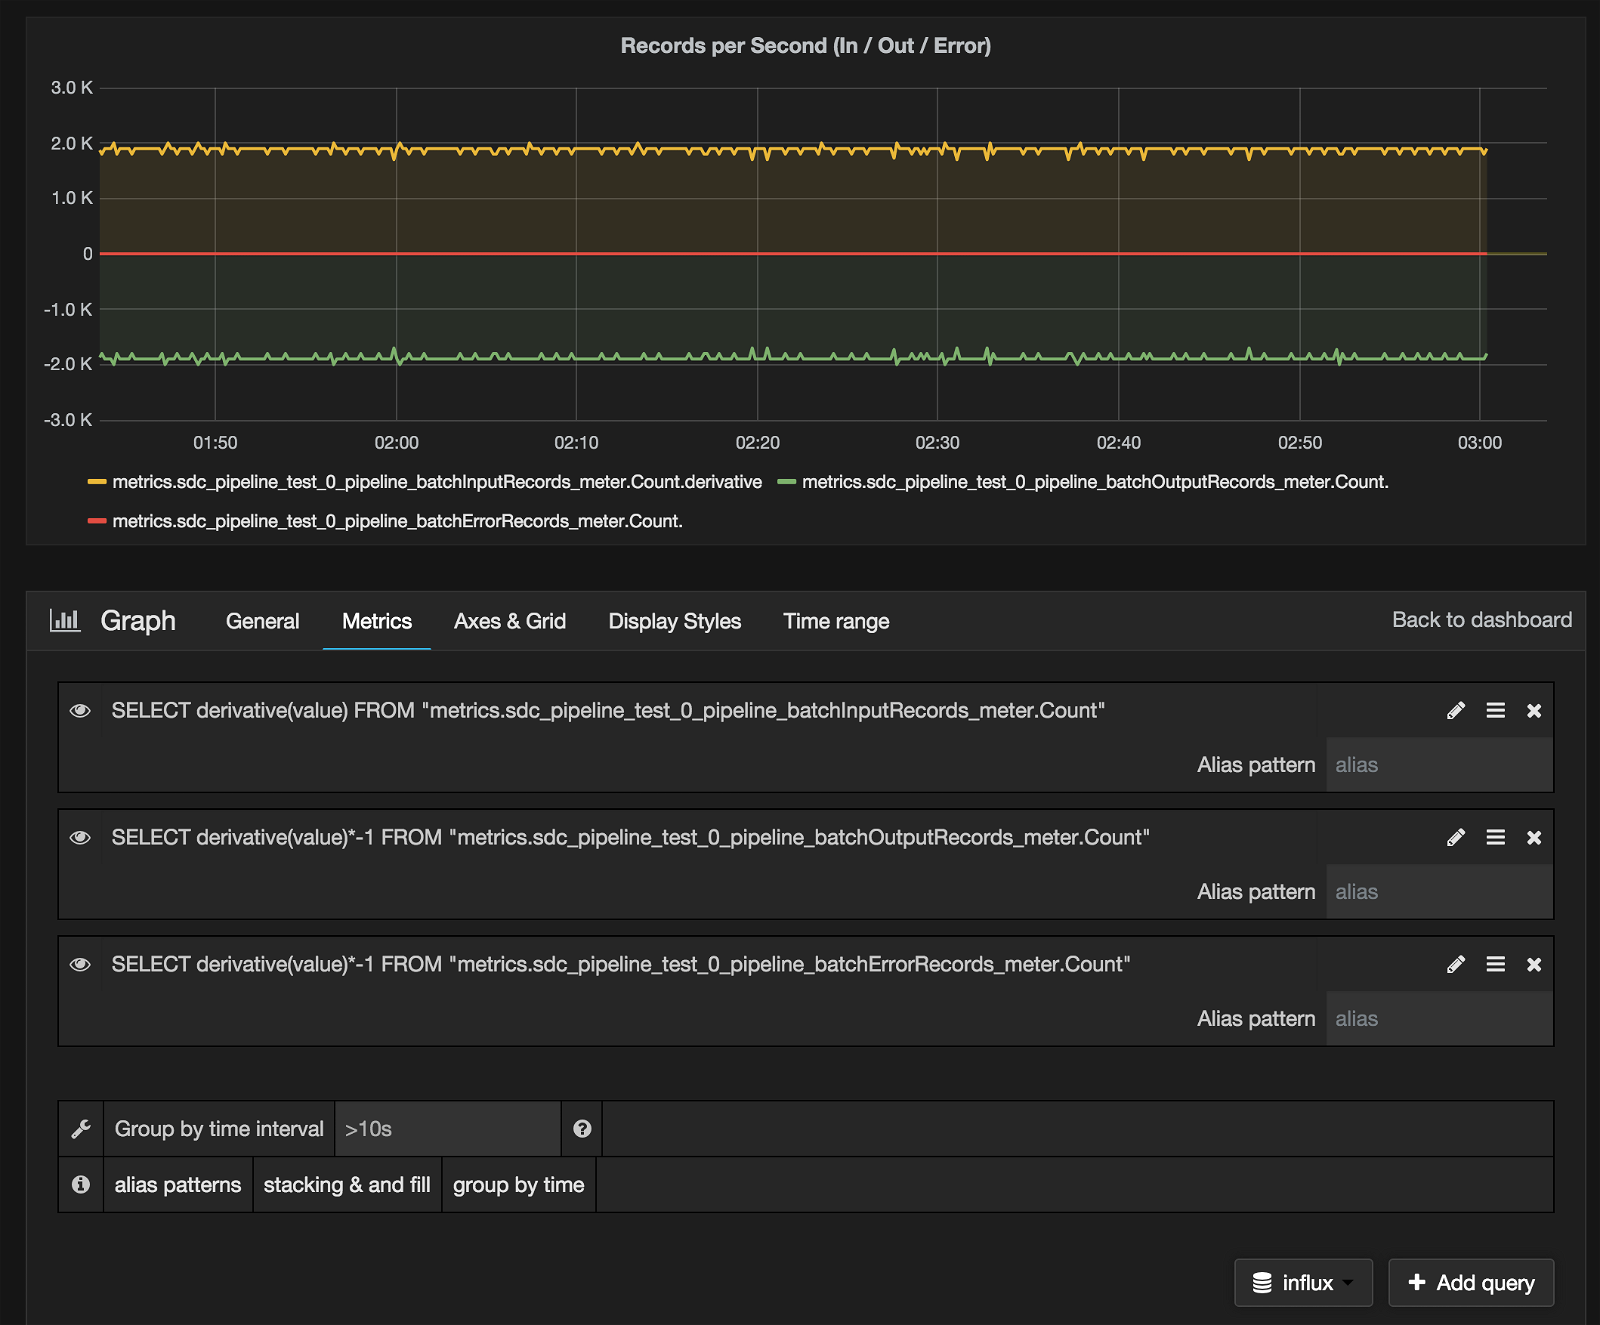
StreamSets provides pre-aggregated rates for many of the metrics, but you can also use the advanced query editor and functions like DERIVATIVE to create custom rate metrics that suit your needs.
You can also import this Complete JSON for Example Grafana Dashboard to try out some charts already setup and ready to go.
Hope you enjoyed this quick start to monitoring using Grafana, InfluxDB, jmxtrans and StreamSets Data Collector.
Now that you’ve walked through step-by-step, you can download the YAML file below and use it with docker-compose or Tutum to launch this setup automatically.
Launch the entire stack with:
docker-compose -f jmxdemo.yml up
- http://www.rittmanmead.com/2015/02/obiee-monitoring-and-diagnostics-with-influxdb-and-grafana/
- https://github.com/tutumcloud/influxdb
- https://github.com/jmxtrans/jmxtrans/wiki/YAMLConfig