Learn how quickly you can start ingesting and aggregating Clickstream logs on Amazon EMR using StreamSets Transformer Engine, and see how the data is analyzed in Elasticsearch, Kibana, and Amazon Redshift.
What is Clickstream Analysis?
Clickstream analysis by definition is the process of collecting, analyzing, and reporting aggregate information about webpage visits. In this blog, we will review how StreamSets Transformer Engine, a Spark ETL engine, running on Amazon EMR can help ingest and aggregate Clickstream logs.
Pipeline Overview
Here are the details of the dataset and data pipeline components:
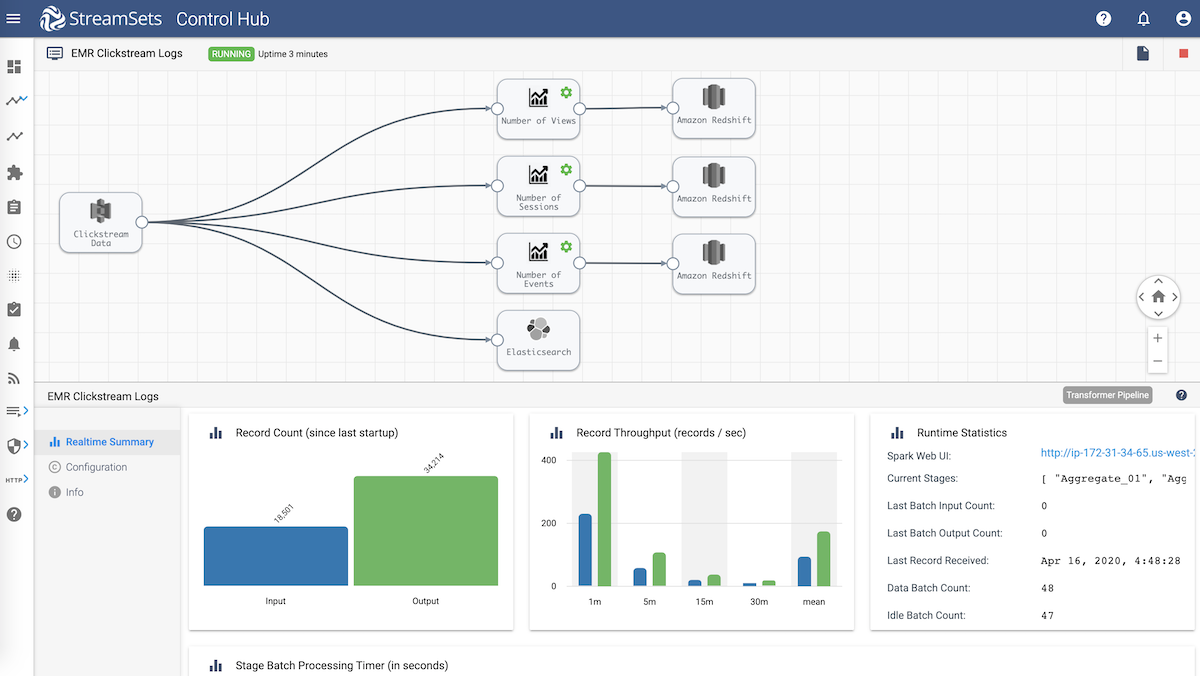
- Dataset and Data Source: Clickstream logs read from Amazon S3
- Transformations: Include aggregations, such as:
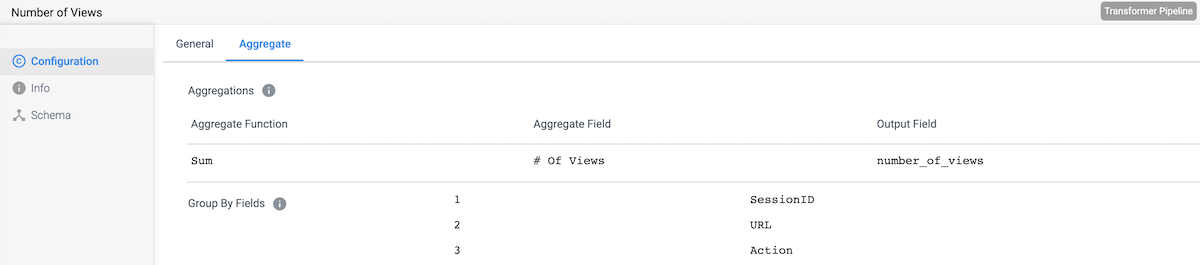
- Number of views for each session with respect to action for a specific URL
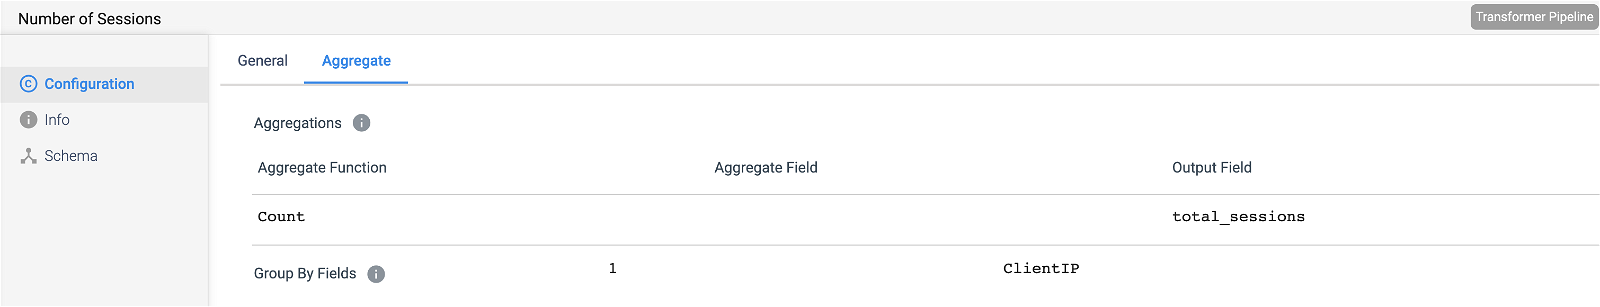
- The total number of sessions for each client IP address
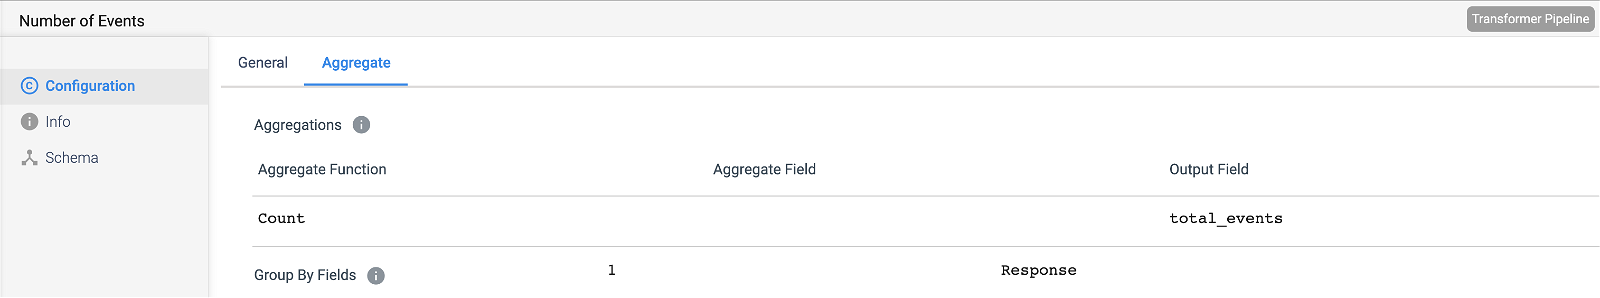
- Number of events captured for each brand of products
- Destinations:
- Aggregations are stored in Amazon Redshift tables. (Note: if the tables don’t already exist, the destination can be configured for the tables to be auto-created.)
- All the logs are sent to Elasticsearch for searching and quick visualizations in Kibana. (Note: if the index doesn’t already exist in Elasticsearch, the destination can be configured for the index to be auto-created.)
Aggregations
Here are the aggregated stats being collected and stored in Amazon Redshift.
Elasticsearch and Kibana
Once the logs were available in Elasticsearch, I created an index pattern called clickstream_data with all the attributes of the logs.
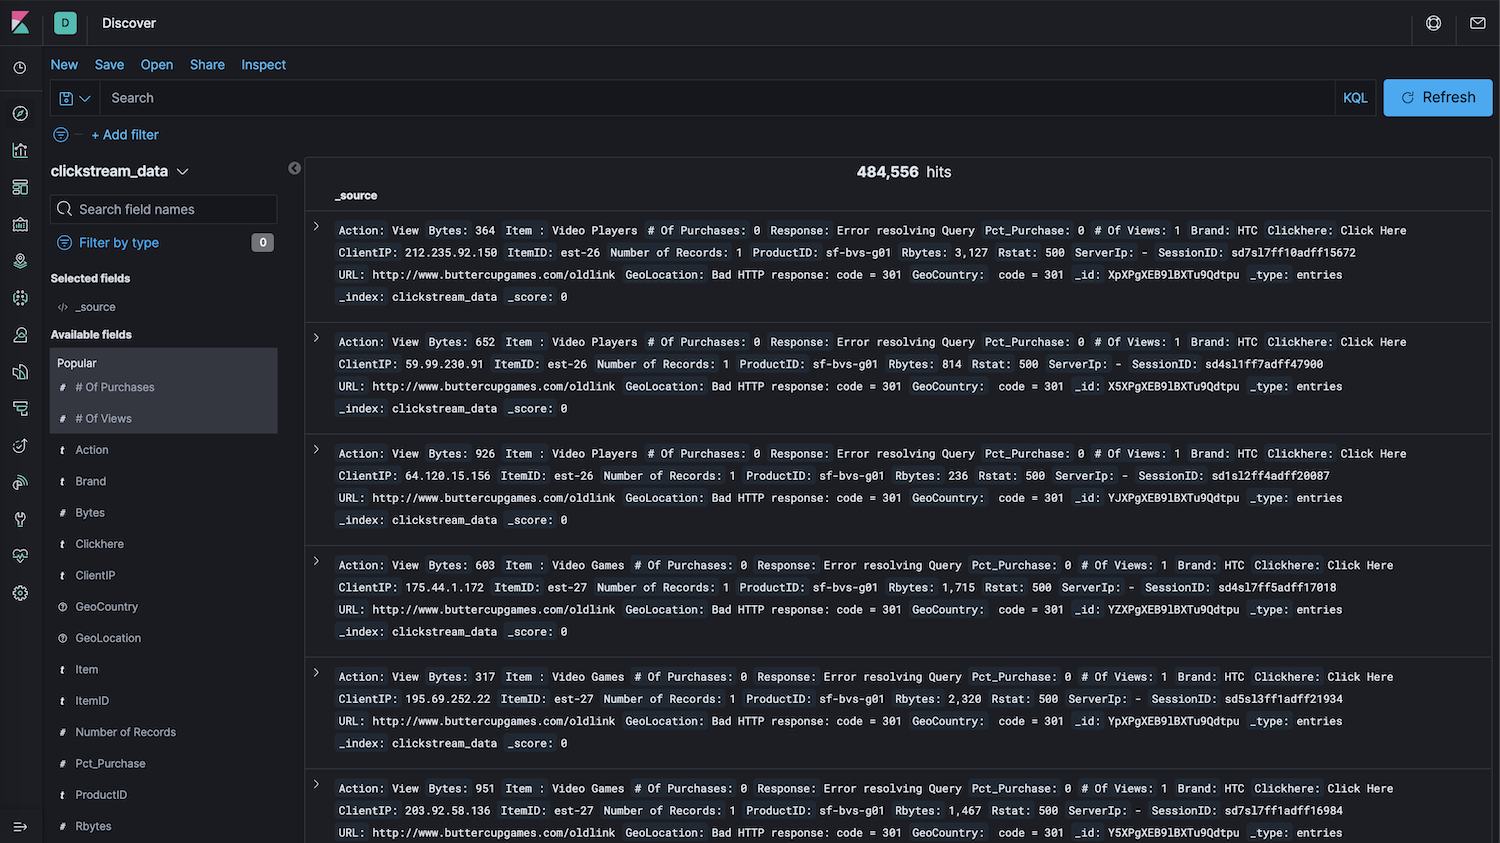
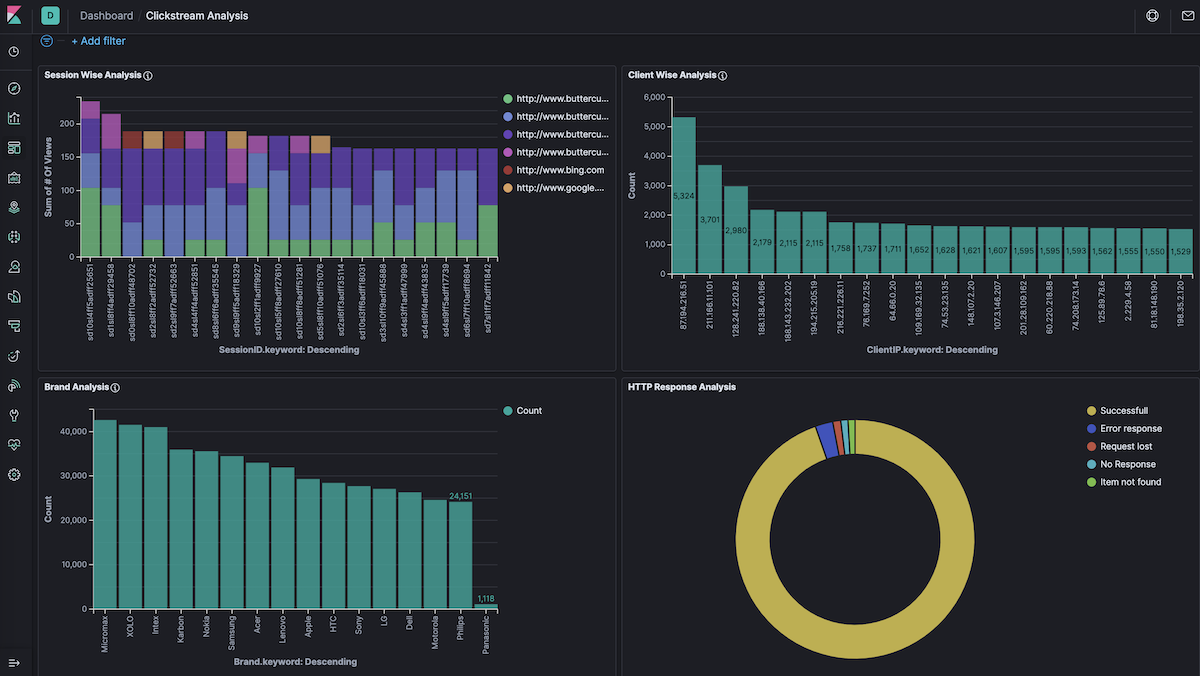
Using the clickstream_data index pattern as source, I then created a dashboard with different visualizations in Kibana.
- Session Wise Analysis — Number of views for each session with respect to action for a specific URL
- Client Wise Analysis — The total number of sessions for each client IP address.
- Brand Analysis — Number of events captured for each brand of products
- HTTP Response Analysis — Number of events captured with a response status such as Successful, Request Lost, No Response, Error Response, etc.
Querying Amazon Redshift
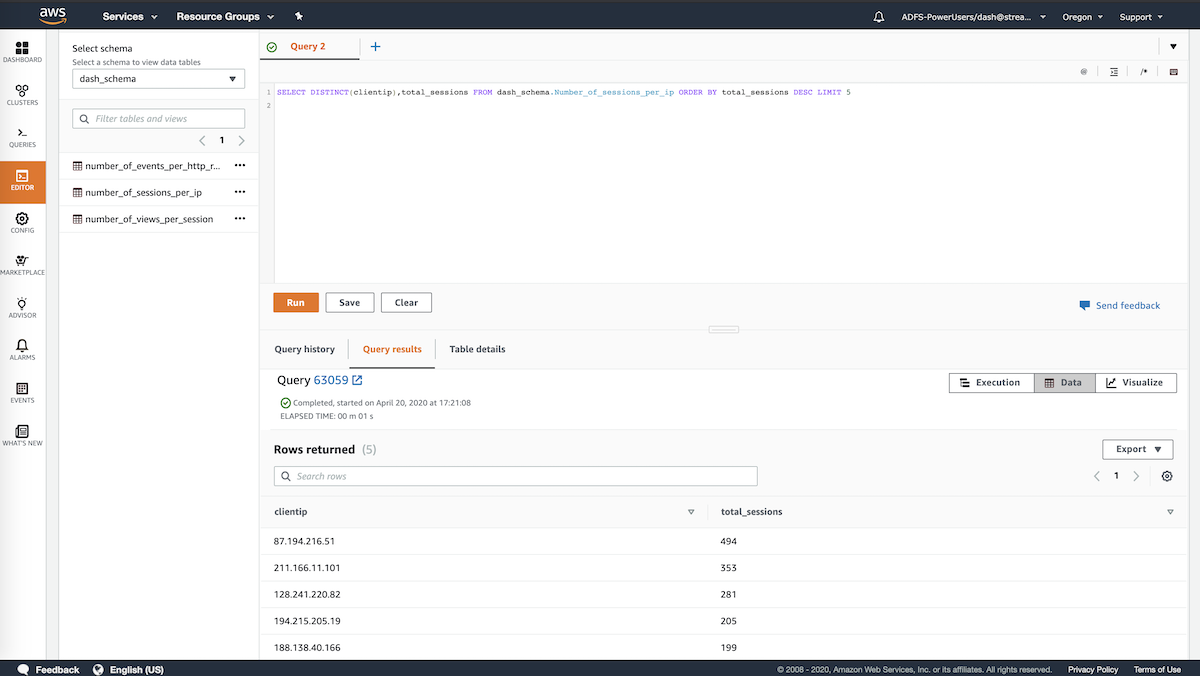
Aggregations are stored in number_of_views_per_session, number_of_sessions_per_ip, and number_of_events_per_http_response Redshift tables for faster-querying. For example, query to see the top 5 IP addresses from where the HTTP sessions were initiated.
SELECT distinct(clientip),total_sessions from number_of_sessions_per_ip order by total_sessions desc limit 5
Watch Demo Video
Summary
While there are different ways to dissect and analyze data, hopefully this blog and demo video gives you ideas on how to use some of these tools you might have at your disposal in order to make better, data-driven decisions, faster.
Learn more about StreamSets For AWS and StreamSets Transformer Engine. Also checkout getting started resources to jumpstart designing your Spark ETL pipelines.