 Last week, I explained how I was able to run StreamSets Data Collector Engine on a Raspberry Pi 3, ingesting sensor data and writing it to Cassandra. With that working, I wanted to show pipeline metrics across data pipelines on Adafruit’s awesome PiTFT Plus 2.8″ screen. In this blog post, I’ll explain how I was able to write a Python app to retrieve pipeline metrics with StreamSets Data Collector REST API, showing them on the PiTFT Plus via pygame to better manage data pipelines.
The StreamSets Data Collector Engine REST API
Data Collector’s REST API gives access to every facet of the application. Using the API, client apps can manipulate pipelines, run previews, capture snapshots; in fact, since the StreamSets web UI is itself a client of the REST API, client apps can use the API to do anything the web UI can do.
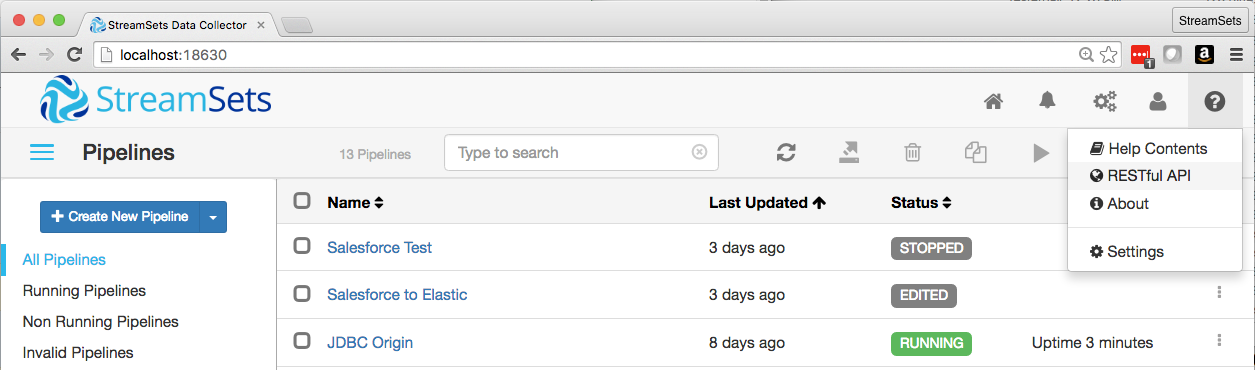
You can explore the Data Collector REST API in the web UI by clicking the ‘Help’ icon (top right) then ‘RESTful API’.
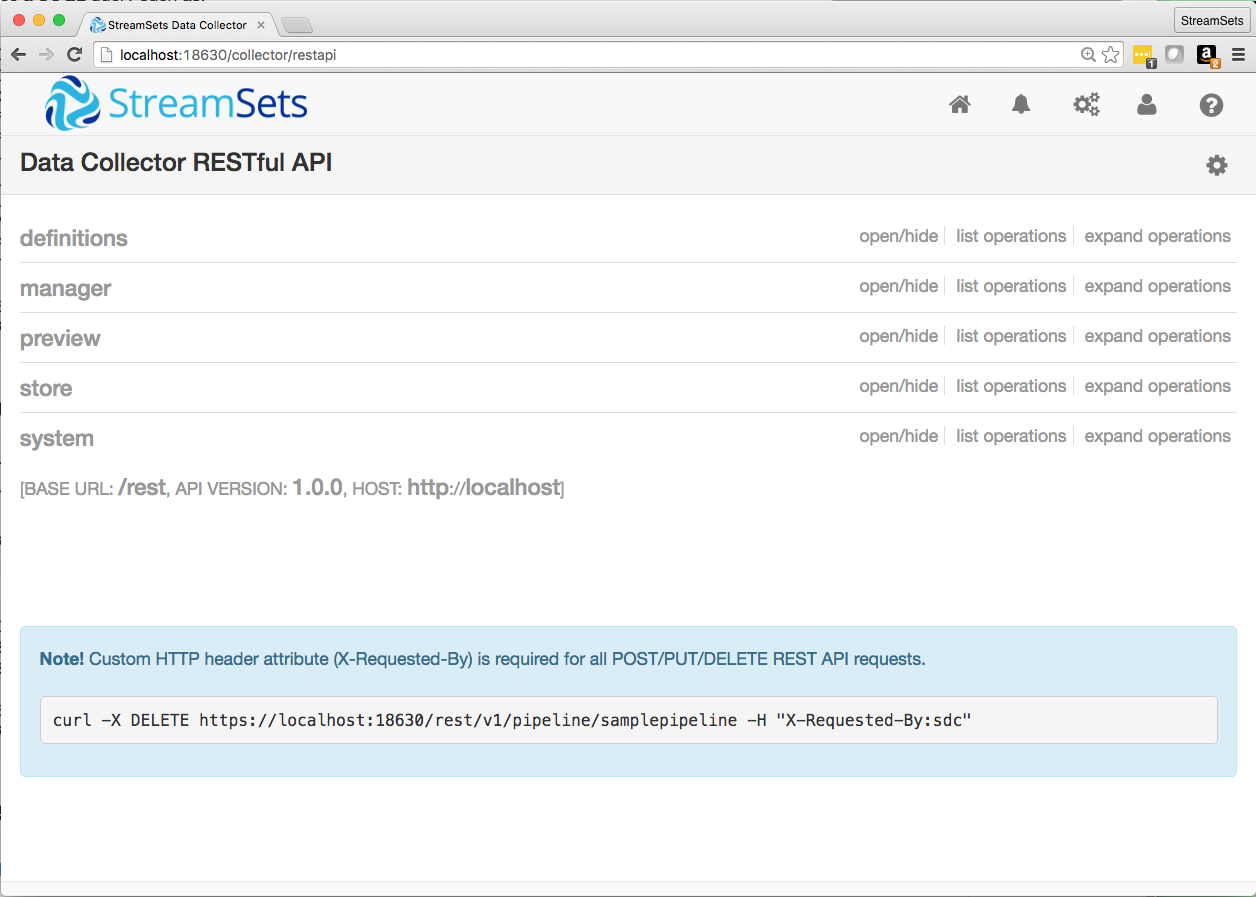
This will show a Swagger-generated interface, allowing you to see the available resources:
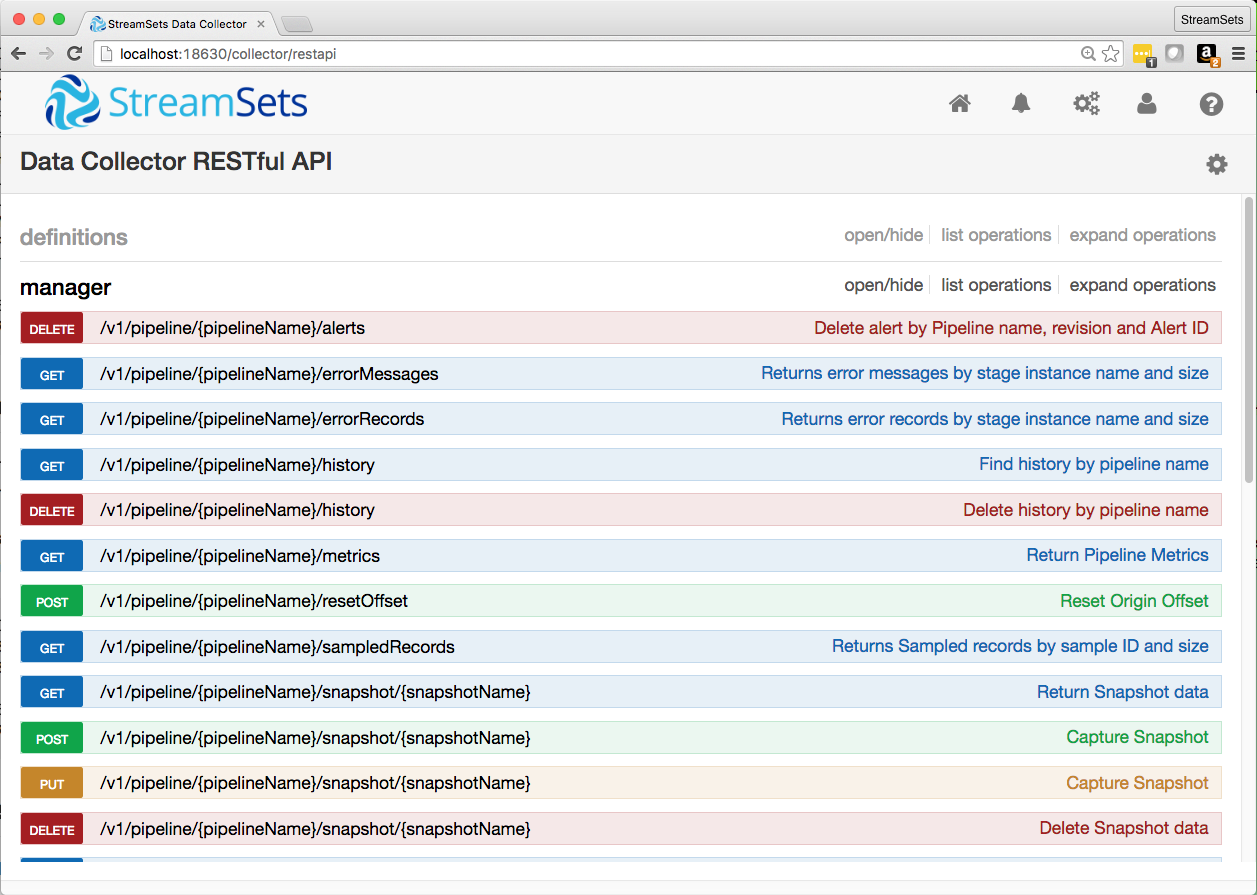
Drilling down into manager, you can see how to start and stop data pipelines, and also how to get data pipeline metrics:
Let’s drill down into the metrics API:
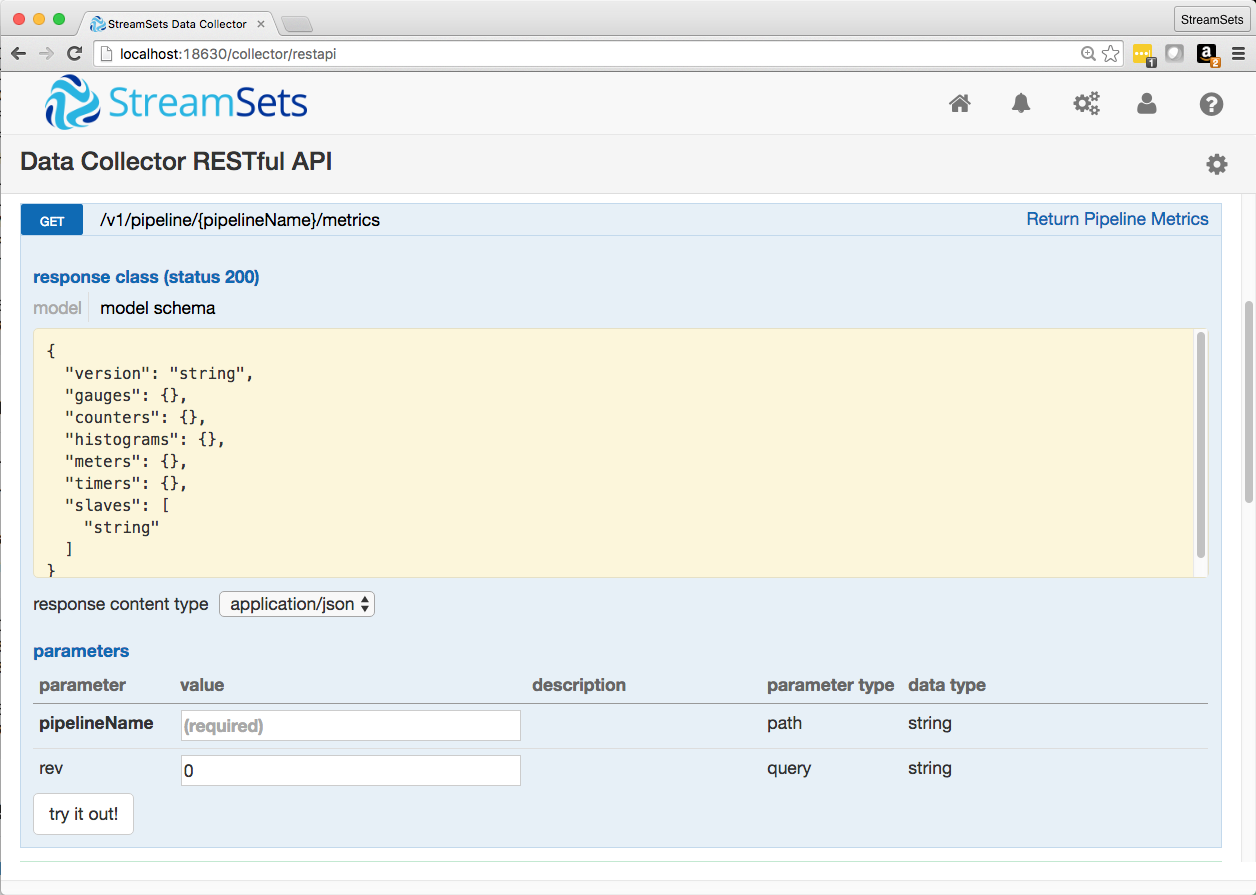
We can see the expected response when we GET the metrics, and the required parameters in a metrics request. We can even plug in a pipeline name and try it out:
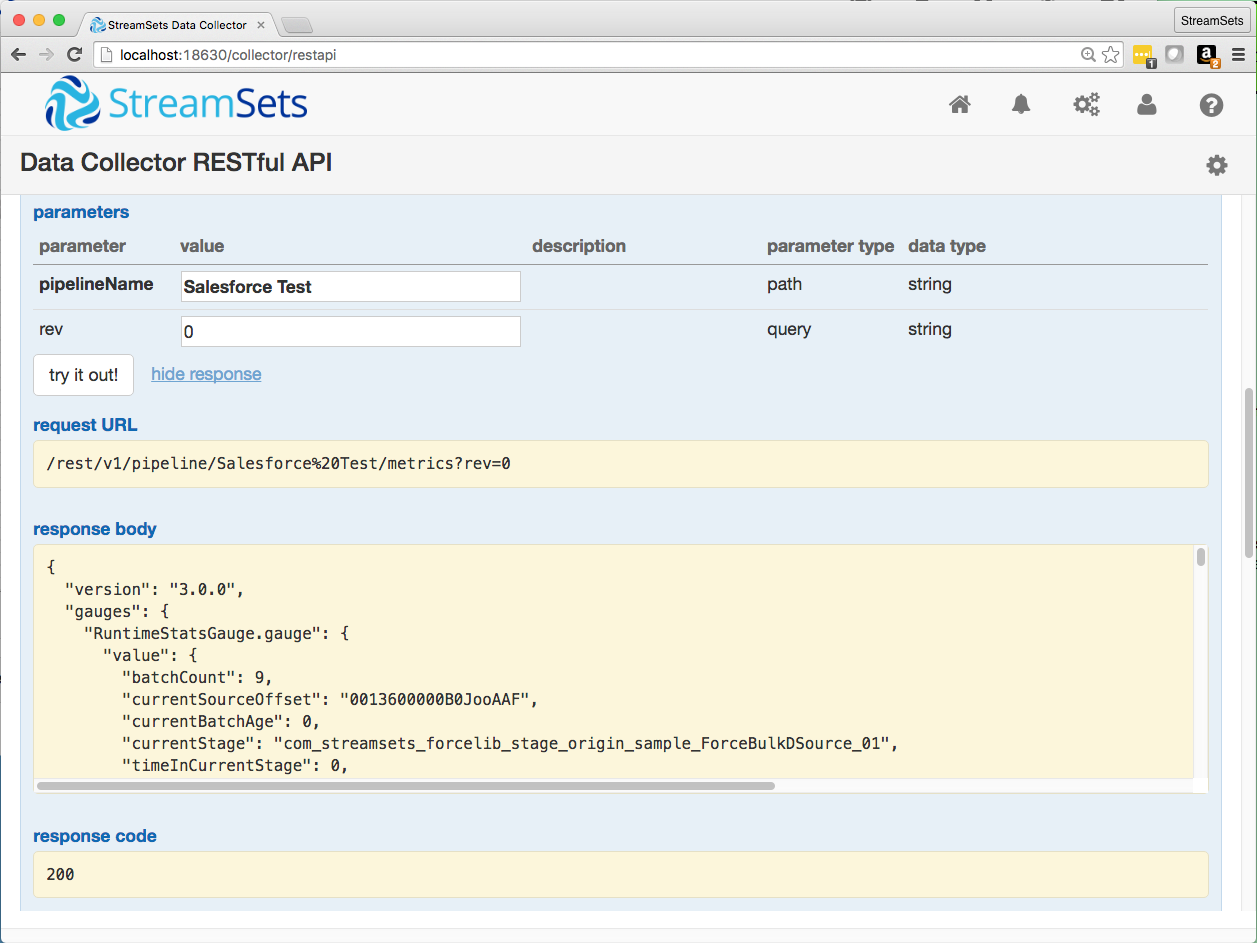
I wanted to replicate the ‘record count’ histogram familiar from the Data Collector web UI; some inspection of the metrics response shows that the input/output/error record counts for the data pipeline are right there:
{
  ...
  "meters" : {
    ...
    "pipeline.batchErrorRecords.meter" : {
      "count" : 5,
      ...
    },
    "pipeline.batchInputRecords.meter" : {
      "count" : 995,
      ...
    },
    "pipeline.batchOutputRecords.meter" : {
      "count" : 990,
      ...
    },
    ...
  }
  ...
}
You can make the same API call from the command line with curl, but you will need to supply the StreamSets admin username and password, and also set the custom X-Requested-By HTTP header:
$ curl http://localhost:18630/rest/v1/pipeline/Salesforce%20Test/metrics?rev=0 \
       -u admin:p4ssw0rd -H "X-Requested-By:myapp"
Armed with this knowledge, I was able to write a simple Python app to retrieve and display metrics:
import argparse
import json
import requests
import urllib

parser = argparse.ArgumentParser(description='Get SDC pipeline metrics.')
parser.add_argument('pipelineName', metavar='pipelineName', nargs=1,
                    help='The name of a pipeline in SDC')
args = parser.parse_args()

pipeline = urllib.quote(args.pipelineName[0])

r = requests.get('http://localhost:18630/rest/v1/pipeline/{}/metrics?rev=0'.format(pipeline),
 auth=('admin', 'p455w0rd'), headers={'X-Requested-By': 'sdc_meters'})
r.raise_for_status()

data = r.json()

print data["meters"]["pipeline.batchInputRecords.meter"]["count"]
print data["meters"]["pipeline.batchOutputRecords.meter"]["count"]
print data["meters"]["pipeline.batchErrorRecords.meter"]["count"]
$ python sdc_meters.py 'JDBC Origin'
9
18
0
StreamSets enables data engineers to build end-to-end smart data pipelines. Spend your time building, enabling and innovating instead of maintaining, rewriting and fixing.
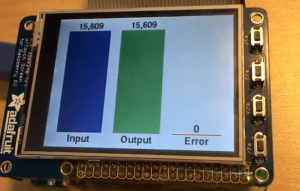
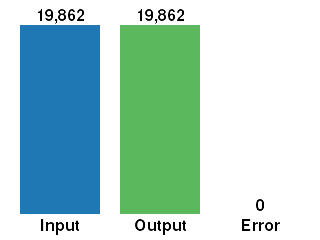
Displaying Metrics on the Raspberry Pi
I followed the instructions given by Adafruit on configuring the Raspberry Pi for the PiTFT Plus display, including the steps for setting up pygame, then worked through Jeremy Blythe‘s excellent tutorial on Raspberry Pi pygame UI basics. Pygame is pretty straightforward, so it only took an hour or two to replicate the record count histogram, most of the time spent tweaking the position of the bars and legends. Here’s a screenshot of the result:
Building on Jeremy’s GPIO sample and some experimentation with the SDC REST API Swagger UI, I was also able to use the PiTFT’s buttons to start and stop the data pipeline. You can grab the code from Gist.
Here’s a short video of the system in action:
Conclusion
The StreamSets Data Collector Engine REST API allows client apps to control every aspect of Data Collector Engine, including starting, stopping and retrieving metrics from data pipelines. A simple Python app allows use of the Raspberry Pi PiTFT Plus screen to control and monitor a pipeline. Start building data pipelines today and and try the API for yourself!