![]() If you’ve been following the StreamSets blog over the past few weeks, you’ll know that I’ve been building an Internet of Things testbed on the Raspberry Pi. First, I got StreamSets Data Collector (SDC) running on the Pi, ingesting sensor data and sending it to Apache Cassandra, and then I wrote a Python app to display SDC metrics on the PiTFT screen. In this blog entry I’ll take the next step, querying Cassandra for statistics on my sensor data.
If you’ve been following the StreamSets blog over the past few weeks, you’ll know that I’ve been building an Internet of Things testbed on the Raspberry Pi. First, I got StreamSets Data Collector (SDC) running on the Pi, ingesting sensor data and sending it to Apache Cassandra, and then I wrote a Python app to display SDC metrics on the PiTFT screen. In this blog entry I’ll take the next step, querying Cassandra for statistics on my sensor data.
Detecting Outlier Values
Now that I have sensor data flowing into Cassandra, I want to analyze that data and then feed it back into SDC so I can detect outlier values. A common way of detecting outliers is to flag readings that fall outside some range expressed in terms of the mean +/- some number of standard deviations (also known as ‘sigma’ or σ). For instance, assuming a normal distribution, 99.7% of values should fall within 3σ of the mean, while 99.95% of values should fall within 4σ. Wikipedia has a handy table with the values. Cassandra can give me the mean of the values in a column, with its avg function, but not standard deviation. Fortunately, though, it’s possible to define your own ‘user-defined aggregate’ (UDA) functions for Cassandra. Here’s how I created a UDA for standard deviation.
Cassandra User Defined Aggregate Functions
Cassandra UDA’s are defined in terms of two user defined functions (UDF’s): a state function and a final function. The state function, called for each row in turn, takes a state parameter and a value as parameters and returns a new state. After all rows have been processed by the state function, the final function is called with the last state value as its parameter, and returns the aggregate value. The Cassandra docs on UDA’s show how to calculate the mean in this way. Let’s pull the two functions out of the example and format them as Java functions to better see how they work:
Tuple avgState(Tuple state, int x) {
    state.setInt(0, state.getInt(0) + 1);
    state.setDouble(1, state.getDouble(1) + x);

    return state;
}

Double avgFinal(Tuple state) {
    double r = 0;

    if (state.getInt(0) == 0)
        return null;

    r = state.getLong(1);
    r /= state.getInt(0);

    return Double.valueOf(r);
}
As you can see, the avgState function keeps track of the count of values and their total, while avgFinal simply divides the total by the count to get the mean. Elementary school math!
Standard deviation, however, is a bit more complicated. A measure of the ‘spread’ of a set of values from their mean, standard deviation is found by “taking the square root of the average of the squared deviations of the values from their average value”. Helpfully, Wikipedia contains an ‘online algorithm‘ for computing variance (the square of standard deviation) in a single pass through the data – just what we need! Transliterating from Wikipedia’s Python implementation to Java, we get:
static Tuple sdState(Tuple state, double x) {
    // For clarity, set up local variables
    int n = state.getInt(0);
    double mean = state.getDouble(1);
    double m2 = state.getDouble(2);

    // Do the calculation
    n++;
    double delta = x - mean;
    mean += delta / n;
    m2 += delta * (x - mean);

    // Update the state
    state.setInt(0, n);
    state.setDouble(1, mean);
    state.setDouble(2, m2);

    return state;
}

static Double sdFinal(Tuple state) {
    int n = state.getInt(0);
    double m2 = state.getDouble(2);

    if (n < 1) {
        // Need at least two values to have a meaningful standard deviation!
        return null;
    }

    // Online algorithm computes variance - take the square root to get standard deviation
    return Math.sqrt(m2 / (n - 1));
}
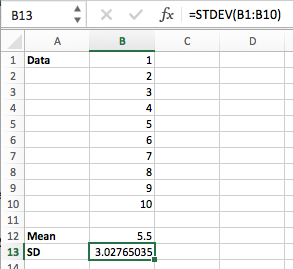
I wrote a test harness to calculate the mean and standard deviation of the integers from 1 to 10 using the ‘online’ algorithm, a simpler iterative algorithm, and also created an Excel spreadsheet to do the same calculation using the AVERAGE() and STDEV() functions. Happily, all three methods gave the same mean of 5.5 and standard deviation of 3.02765!
One piece of housekeeping was necessary before I could actually define my own function: since I’m using Cassandra 2.2, I needed to add the following line to cassandra.yaml:
enable_user_defined_functions: true
Cassandra 3.0 lets you define Java functions without explicitly enabling them. See the docs on UDF’s for more details.
That done, I just needed to remove comments and line breaks from my Java functions, paste them into the Cassandra function definitions and feed them into cqlsh:
cqlsh:mykeyspace> CREATE OR REPLACE FUNCTION sdState ( state tuple<int,double,double>, val double ) CALLED ON NULL INPUT RETURNS tuple<int,double,double> LANGUAGE java AS
 ... 'int n = state.getInt(0); double mean = state.getDouble(1); double m2 = state.getDouble(2); n++; double delta = val - mean; mean += delta / n; m2 += delta * (val - mean); state.setInt(0, n); state.setDouble(1, mean); state.setDouble(2, m2); return state;';

cqlsh:mykeyspace> CREATE OR REPLACE FUNCTION sdFinal ( state tuple<int,double,double> ) CALLED ON NULL INPUT RETURNS double LANGUAGE java AS
 ... 'int n = state.getInt(0); double m2 = state.getDouble(2); if (n < 1) { return null; } return Math.sqrt(m2 / (n - 1));';

cqlsh:mykeyspace> CREATE AGGREGATE IF NOT EXISTS stdev ( double )
 ... SFUNC sdState STYPE tuple<int,double,double> FINALFUNC sdFinal INITCOND (0,0,0);
So far, so good… Let’s find the mean and standard deviation of the integers from 1 to 10 in Cassandra:
cqlsh:mykeyspace> CREATE TABLE one_to_ten (value double PRIMARY KEY);
cqlsh:mykeyspace> INSERT INTO one_to_ten (value) VALUES (1);
cqlsh:mykeyspace> INSERT INTO one_to_ten (value) VALUES (2);
cqlsh:mykeyspace> INSERT INTO one_to_ten (value) VALUES (3);
cqlsh:mykeyspace> INSERT INTO one_to_ten (value) VALUES (4);
cqlsh:mykeyspace> INSERT INTO one_to_ten (value) VALUES (5);
cqlsh:mykeyspace> INSERT INTO one_to_ten (value) VALUES (6);
cqlsh:mykeyspace> INSERT INTO one_to_ten (value) VALUES (7);
cqlsh:mykeyspace> INSERT INTO one_to_ten (value) VALUES (8);
cqlsh:mykeyspace> INSERT INTO one_to_ten (value) VALUES (9);
cqlsh:mykeyspace> INSERT INTO one_to_ten (value) VALUES (10);
cqlsh:mykeyspace> SELECT COUNT(*), AVG(value), STDEV(value) FROM one_to_ten;

 count | system.avg(value) | mykeyspace.stdev(value)
-------+-------------------+-------------------------
    10 |               5.5 |                 3.02765
Success! Now let’s try getting statistics for the past day’s temperature readings:
cqlsh:mykeyspace> SELECT COUNT(*), AVG(temperature), STDEV(temperature) FROM sensor_readings
WHERE sensor_id = 1 AND time > '2016-07-26 15:00:00-0700';

count  | system.avg(temperature) | mykeyspace.stdev(temperature)
-------+-------------------------+-------------------------------
 1417  |                32.48066 |                      0.867008
It’s been hot here in San Jose, California!
Now I’m able to get statistics from Cassandra, the next trick is to feed them into SDC to be able to filter out outlier values for closer inspection. I’ll cover that in my next blog entry. Watch this space!