![]() Back in January, Adam blogged about StreamSets Monitoring with Grafana, InfluxDB, and jmxtrans. While the Grafana/InfluxDB/jmxtrans open source stack works great, there’s quite a lot of setup and configuration to keep track of. Another tool that StreamSets customers are using to monitor their infrastructure is Datadog; in today’s blog post I’ll show you the basics of configuring Datadog with StreamSets Data Collector (SDC).
Back in January, Adam blogged about StreamSets Monitoring with Grafana, InfluxDB, and jmxtrans. While the Grafana/InfluxDB/jmxtrans open source stack works great, there’s quite a lot of setup and configuration to keep track of. Another tool that StreamSets customers are using to monitor their infrastructure is Datadog; in today’s blog post I’ll show you the basics of configuring Datadog with StreamSets Data Collector (SDC).
Sign up for Datadog
There are three tiers of Datadog service: Free, Pro and Enterprise. The free tier covers up to 5 hosts, so it’s ideal for experimenting. You can also try out a higher tier free for 14 days, so you can see how it works for dozens, or even hundreds of servers before handing over your credit card. Sign up for Datadog (free).
Download the Datadog Agent
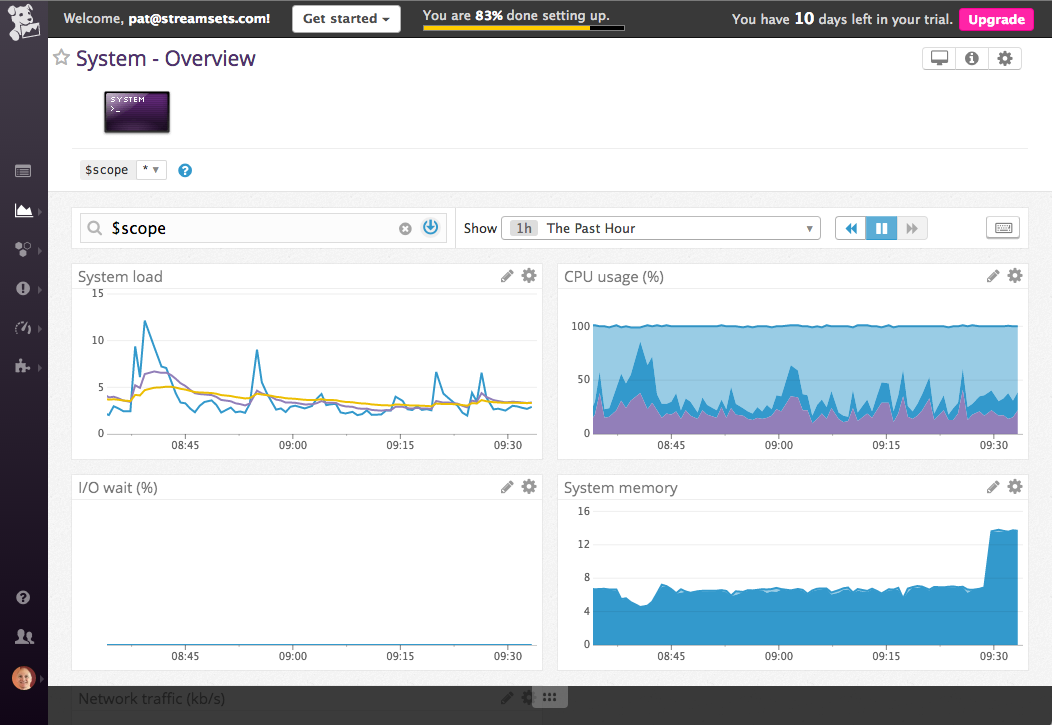
I was prompted to download an agent after I signed up. There are agents for a wide range of environments; I was able to install and run it on my MacBook Air without any problems, and see my laptop’s CPU usage, memory usage, etc
Enable JMX Remote Monitoring in StreamSets Data Collector
Follow the documentation to enable remote JMX access to SDC. I added the suggested SDC_JAVA_OPTS setting to the SDC environment file at libexec/sdc-env.sh, appending ${SDC_JAVA_OPTS} to the setting so that SDC also picks up any existing settings in the environment:
# JMX
export SDC_JAVA_OPTS="-Dcom.sun.management.jmxremote \
 -Dcom.sun.management.jmxremote.port=3333 \
 -Dcom.sun.management.jmxremote.local.only=false \
 -Dcom.sun.management.jmxremote.authenticate=false \
 -Dcom.sun.management.jmxremote.ssl=false \
 ${SDC_JAVA_OPTS}"
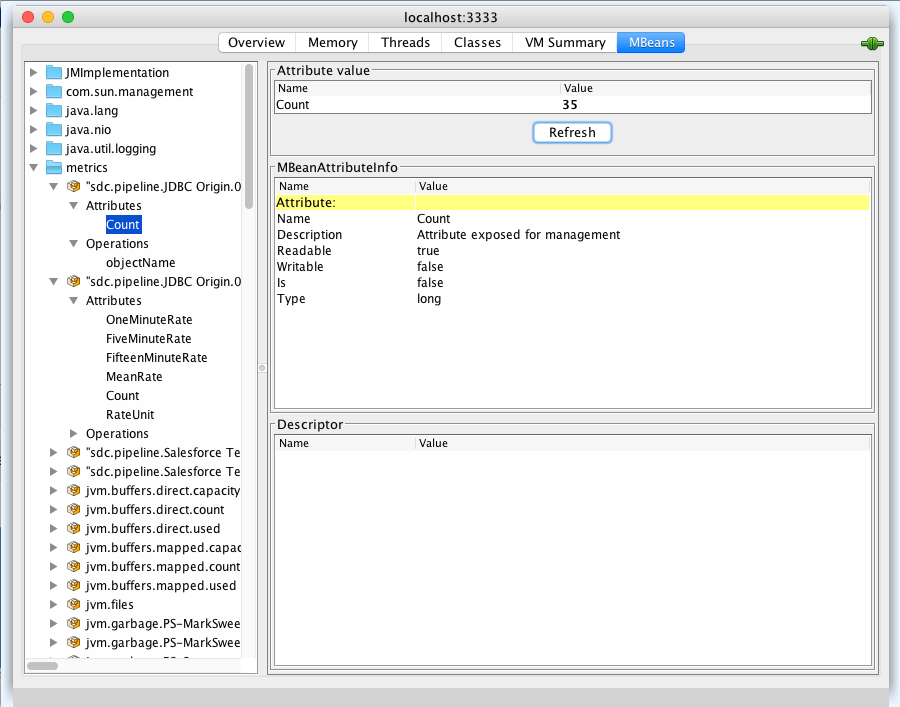
After restarting SDC, I tested JMX connectivity with JConsole:
$ jconsole localhost:3333
Success! I was able to see all of the MBeans exposed by SDC:
Enable the Java Integration
The Datadog agent’s configuration directory (/opt/datadog-agent/etc/conf.d on a Mac, but this varies by platform) contains sample YAML configuration files for a wide variety of integrations. I opened jmx.yaml.example and saved it as jmx.yaml, with the following content:
init_config:

instances:
  - host: localhost
    port: 3333
    name: streamsets
    conf:
      # Gather record count and rate metrics from StreamSets pipelines
      - include:
          domain: metrics
          attribute:
            - Count
            - OneMinuteRate
            - FiveMinuteRate
            - FifteenMinuteRate
            - MeanRate
      # Gather threading stats for the JVM
      - include:
          domain: java.lang
          bean: java.lang:type=Threading
          attribute:
            - DaemonThreadCount
            - PeakThreadCount
            - ThreadCount
            - TotalStartedThreadCount
The Datadog JMX documentation covers the YAML config file’s syntax; you should be able to add more metrics by browsing the available MBeans in jconsole and editing jmx.yaml. Note – you will need to restart the Datadog agent after each change to the config file.
Visualize SDC Metrics
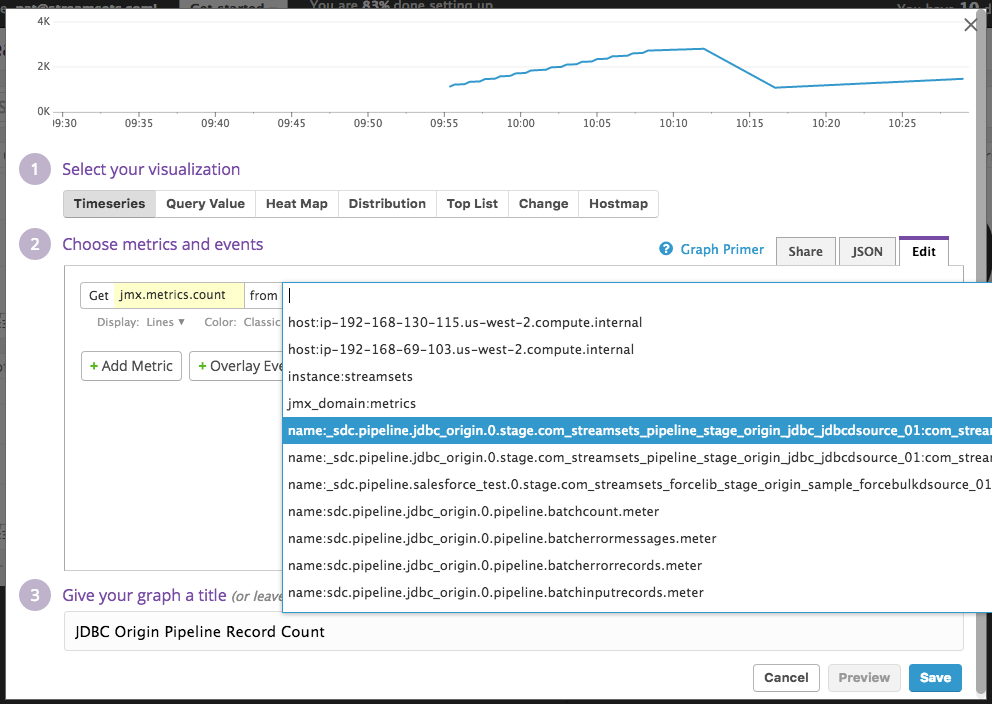
I created a new dashboard in Datadog, and added time series graphs and query values for a pipeline’s record count and the SDC JVM’s thread count. It was pretty easy to add metrics just by typing part of the metric name and picking from the popup list. SDC pipeline metrics have the form:
sdc.pipeline.<pipeline name>.<pipeline revision>.<category: pipeline|stage|custom>.\
[<stage library>_<library revision>].<metric name>.<metric type>
They’re pretty easy to find in the Datadog UI:
The resulting visualization looks great! I can see at a glance the record count of my pipeline, and the number of threads that SDC is running:
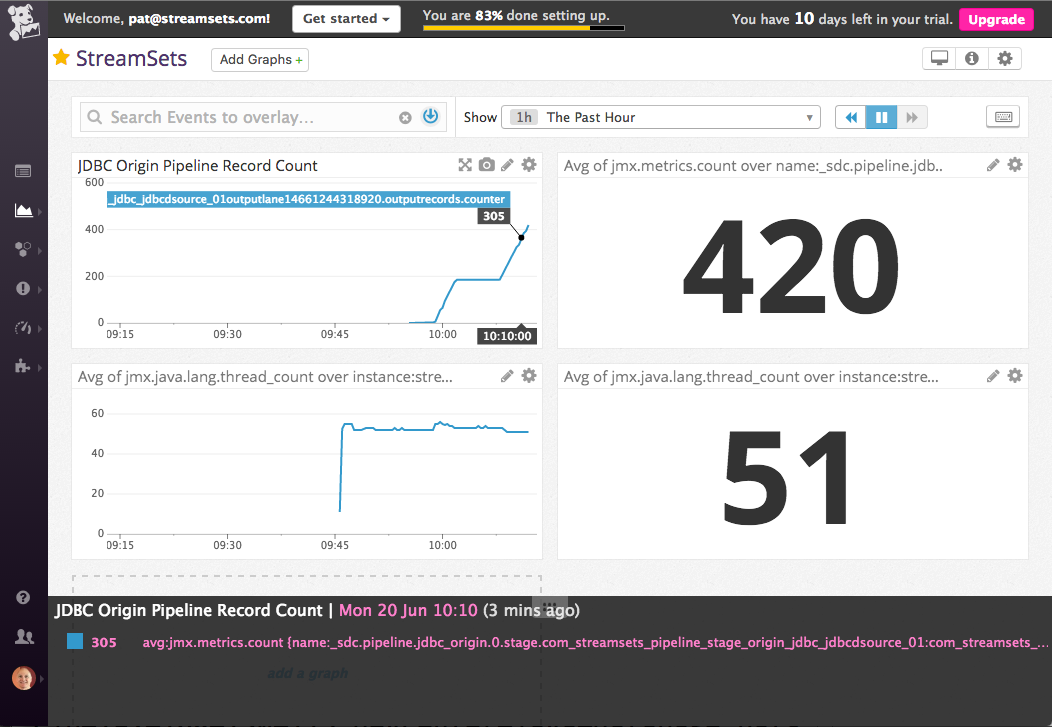
This blog post just scratches the surface of Datadog’s capabilities. As well as showing graphs and values, you can annotate dashboard graphs, share them across teams, and set alerts on critical issues.
Conclusion: Configuring Datadog with StreamSets.
StreamSets Data Collector’s JMX implementation exposes a whole raft of metrics for collection and analysis, while Datadog provides an attractive, easy to use visualization service. Download SDC, configure a pipeline, hook it up to Datadog and see for yourself!