 Sandish Kumar, a Solutions Engineer at phData, builds and manages solutions for phData customers. In this article, reposted from the phData blog, he explains how to generate simulated NetFlow data, read it into StreamSets Data Collector via the UDP origin, then buffer it in Apache Kafka before sending it to Apache Kudu. A true big data enthusiast, Sandish spends his spare time working to understand Kudu internals.
NetFlow is a data format that reflects the IP statistics of all network interfaces interacting with a network router or switch. NetFlow records can be generated and collected in near real-time for the purposes of cybersecurity, network quality of service, and capacity planning. For network and cybersecurity analysts interested in these data, being able to have fast, up-to-the second insights can mean faster threat detection and higher quality network service.
Ingesting data and making it immediately available for query in Hadoop has traditionally been difficult, requiring a complex architecture commonly known as the Lambda architecture. Lambda requires the coordination of two storage layers: the “speed layer” and the “batch layer”. The complexity of Lambda has put many real-time analytical use-cases out of reach for Hadoop. However, with Apache Kudu we can implement a new, simpler architecture that provides real-time inserts, fast analytics, and fast random access, all from a single storage layer. In this article, we are going to discuss how we can use Kudu, Apache Impala (incubating), Apache Kafka, StreamSets Data Collector (SDC), and D3.js to visualize raw network traffic ingested in the NetFlow V5 format.
The data will flow through the following stages:
- A UDP NetFlow simulator generates a stream of NetFlow events.
- A StreamSets Data Collector ingest pipeline consumes these events in real-time and persists them into Kafka. A second pipeline then performs some in-stream transformations and then persists events into Kudu for analytics
- A D3 visualization then queries Kudu via Impala
Network Traffic Simulator to Kafka
The goal of this section is to simulate network traffic and send that data to Kafka.
Step 1: Install and Run StreamSets Data Collector
- Download the StreamSets Data Collector TGZ binary from its download page, extract and run it:
$ tar xvzf streamsets-datacollector-all-2.0.0.0.tgz
$ cd streamsets-datacollector-2.0.0.0/
$ bin/streamsets dc
- Once you see the message Running on URI : ‘http://localhost:18630′ , navigate to
localhost:18630on your favorite browser and useadmin/adminas username/password
Step 2: Create a Pipeline from UDP Origin to Kafka Producer
- On the StreamSets Dashboard, click on + Create New Pipeline and specify the name, “UDP Kafka Producer”, and description, “Source data from UDP to Kafka”, of the pipeline.
- Click on the Save button.
- Once you’ve done this, a grid should appear on your screen with a few icons on the right hand side.
- Make sure the drop down selector reads ‘Origins’. The various icons below list the data sources that StreamSets can read from. Scroll down to find the icon that reads ‘UDP Source’, and drag the icon onto the StreamSets grid.
- Once the UDP Source is in place, click on it. In the Configuration Panel below, select the UDP tab and change the Data Format to NetFlow. Leave Port and all other settings with their default values.
- Now let’s create a Kafka Producer! Change the drop down selector on the right from “Origins” to “Destinations”, and drag the “Kafka Producer” onto the StreamSets grid
- In the Kafka producer configuration, select Kafka and change TopicName to “NETFLOW”
- Make sure that Data Format is “SDC Record”
- Now let’s connect “UDP Source” to “Kafka Producer” by dragging an arrow from the UDP Source to the Kafka Producer.
Finally, click in the background of the grid, then, in the bottom pane, Configuration, Error Records and set Error Records to Discard.

Step 3: Test Data Transfer between Traffic Simulator and Kafka Producer
- Start the kafka consumer by running the following command on the shell. Set your Zookeeper host as appropriate.
$ kafka-console-consumer --zookeeper zk_host:2181 --topic NETFLOW --from-beginning
- Let’s now start the UDP Kafka Producer pipeline by clicking on the Start button on the top right corner of the StreamSets Dashboard.
- Get UPDClient.java here and dataset-3-raw-netflow here
- Start the Traffic Simulator by compiling and running the Java-based UDP client using the shell:
$ javac UDPClient.java
$ java UDPClient dataset-3-raw-netflow
- Upon success, you should see something like this on your Kafka Consumer terminal and the visualization in StreamSets:
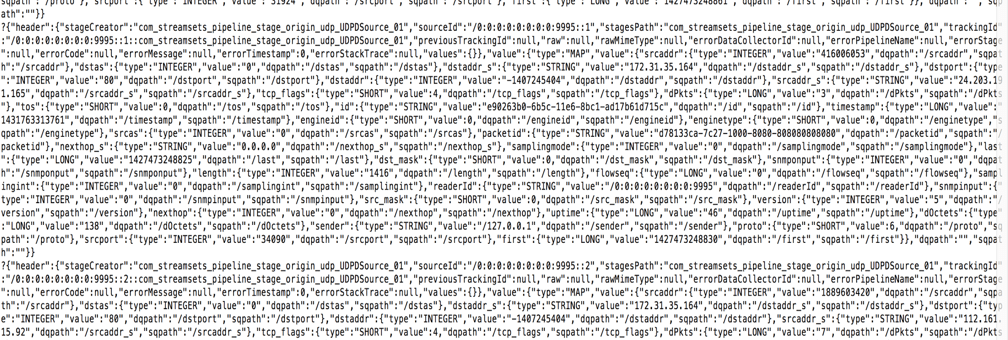
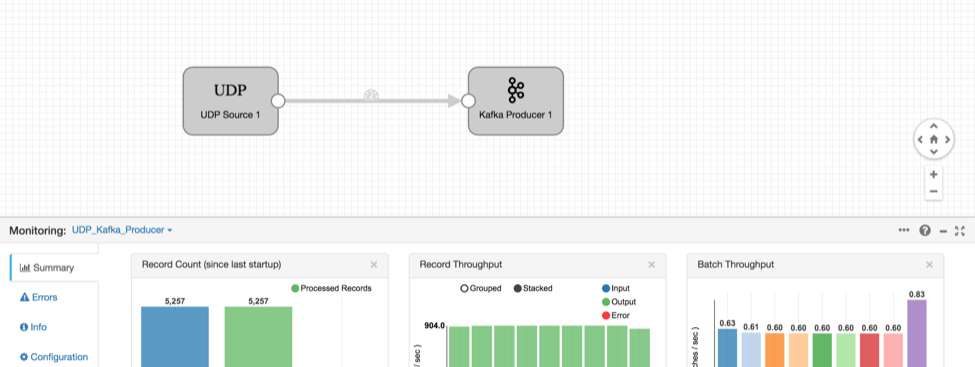

StreamSets Data Collector is now receiving the UDP data, parsing the NetFlow format, and sending it to Kafka in its own internal record format. Kafka can buffer the records while we build another pipeline to write them to Kudu.
Kafka to Kudu
The goal of this section is to read the data from Kafka and ingest into Kudu, performing some lightweight transformations along the way.
Step 1: Create a New Table in Kudu
Start the impala-shell on your terminal, and paste the sql query given below to create an empty table called “netflow“
CREATE TABLE netflow(
    id string,
    packet_timestamp string,
    srcaddr string,
    dstas string,
    dstaddr_s string,
    dstport int32,
    dstaddr string,
    srcaddr_s string,
    tcp_flags string,
    dPkts string,
    tos string,
    engineid string,
    enginetype string,
    srcas string,
    packetid string,
    nexthop_s string,
    samplingmode string,
    dst_mask string,
    snmponput string,
    length string,
    flowseq string,
    samplingint string,
    readerId string,
    snmpinput string,
    src_mask string,
    version string,
    nexthop string,
    uptime string,
    dOctets string,
    sender string,
    proto string,
    srcport int32)
DISTRIBUTE BY HASH(id) INTO 4 buckets, RANGE (packet_timestamp) SPLIT ROWS(('2015-05-01'), ('2015-05-02'), ('2015-05-03'), ('2015-05-05'))
TBLPROPERTIES(
    'storage_handler' = 'com.cloudera.kudu.hive.KuduStorageHandler',
    'kudu.table_name' = ‘netflow’,
    'kudu.master_addresses' = '{kudu master}',
    'kudu.key_columns' = 'id,packet_timestamp’
);
The table netflow is hash partitioned by the id field which is a unique key and should result in the rows being uniformly distributed among buckets and thus cluster nodes. Hash partitioning provides us high throughput for writes because (provided there are enough buckets) all nodes will contain a hash partition. Hash partitioning also provides for read parallelism when scanning across many id values because all nodes which contain a hash partition will participate in the scan.
The table also has been range partitioned by time so that for queries scanning only a specific time slice can exclude tablets not containing relevant data. This should increase cluster parallelism for large scans (across days) while limiting overhead for small scans (single day). Range partitioning also ensures partition growth is not unbounded and queries don’t slow down as the volume of data stored in the table grows, because we would be querying only certain portion of data and data is distributed across nodes by hash and range partitions.
The above table creation schema creates 16 tablets; first it creates 4 buckets hash partitioned by ID field and then 4 range partitioned tablets for each hash bucket. When writing data to Kudu, a given insert will first be hash partitioned by the id field and then range partitioned by the packet_timestamp field. The result is that writes will spread out to four tablets (servers). Meanwhile read operations, if bounded to a single day, will query only the tablets containing data for that day. This is important: without much effort, we are able to scale out writes and also bound the amount of data read on time series reads.
Step 2: Build the Pipeline
- If you don’t already have Kudu, you will need to either download and run the Kudu Quickstart VM or install Kudu and Impala-Kudu integration.
- If you’re still in the UDP Kafka Producer pipeline, click the ‘Pipelines’ link (top left).
- Click on + Create New Pipeline and enter the pipeline name, “Kafka Consumer to Apache Kudu”, and Description, “Loading data from Kafka consumer to Apache Kudu”.
- Click on the Save button
- Once you’ve done this, an empty SDC grid should appear on your screen with a few icons on the right hand side.
- Make sure the drop down selector reads ‘Origins’. Scroll down to find the icon that reads “Kafka Consumer”, and drag the icon onto the StreamSets canvas.
- Once the Kafka consumer is in place, click on it. In the configuration panel below, select the Kafka tab and change Data Format to “SDC Record”, and set the topic name to “NETFLOW” (Make sure it’s the same name as above)
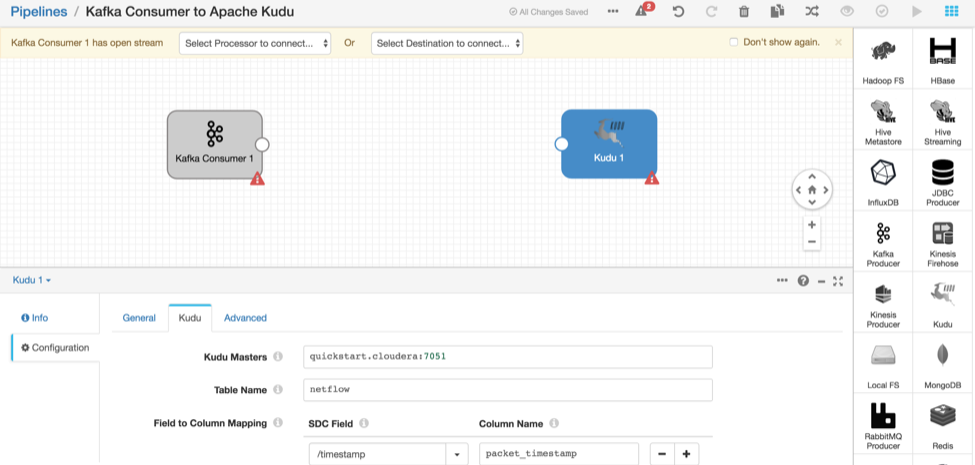
- Now let’s create Apache Kudu as a destination. On the drop down selector, select “destinations” and drag the “Apache Kudu” icon onto the Map
- Select the Kudu tab and enter the appropriate details for your cluster
Kudu Masters Kudu master hostname Table Name netflow - The word timestamp is reserved in Impala, so let’s rename the field. Set “Field to Column Mapping” to:
SDC Field Column Name /timestamp packet_timestamp

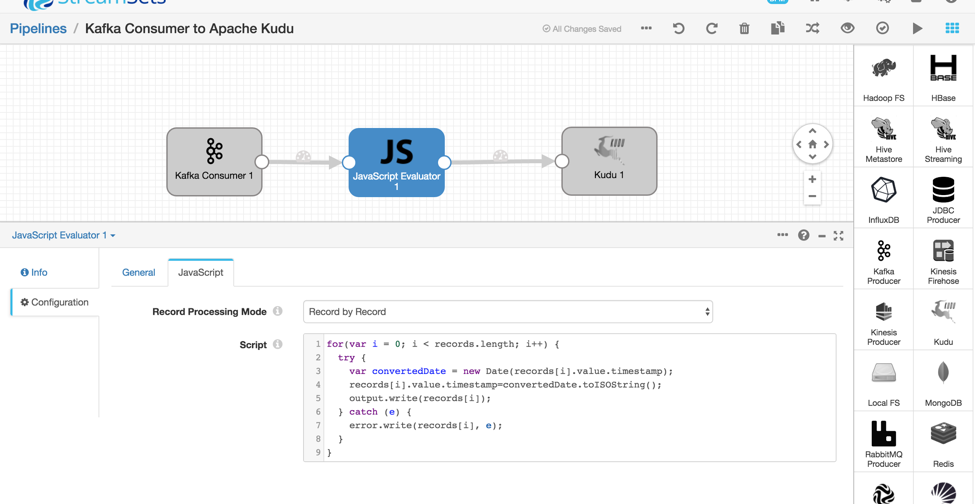
Now we’ll use a JavaScript Evaluator to convert the timestamp field from a long integer to DateTime ISO String format which will be compatible with Kudu range partition queries. (Note this should be possible via a field converter in the future.) We’ll talk more about range partitions later below. For now, let’s draw a JavaScript Evaluator between Kafka Consumer and Apache Kudu.
- In the drop down selector, select “Processors”. Drag the “JavaScript Evaluator” icon and drop it in between the Kafka Consumer and Apache Kudu. Draw intermediate paths between Kafka Consumer → JavaScript Evaluator and JavaScript Evaluator → Kudu
- Select the JavaScript tab and replace the script with this code:
for(var i = 0; i < records.length; i++) {
  try {
    var convertedDate = new Date(records[i].value.timestamp);
    records[i].value.timestamp=convertedDate.toISOString();
    output.write(records[i]);
  } catch (e) {
    error.write(records[i], e);
  }
}
If everything you’ve done so far is correct is set, clicking on “Validate” will return a success message
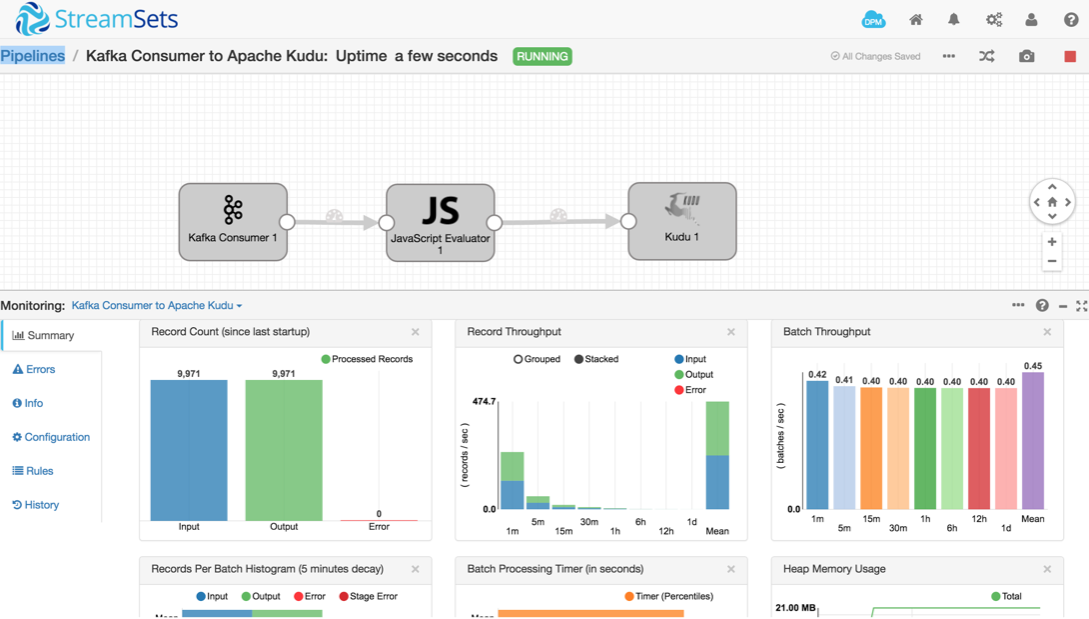
Step 3: Test the entire topology: UDP → KafkaProducer → KafkaConsumer → ApacheKudu
- Ensure both the traffic simulator and the UDP Kafka Producer pipeline are running
- On the “Kafka Consumer to Apache Kudu” pipeline, click the “start” button
- You should see some statistics as seen below:
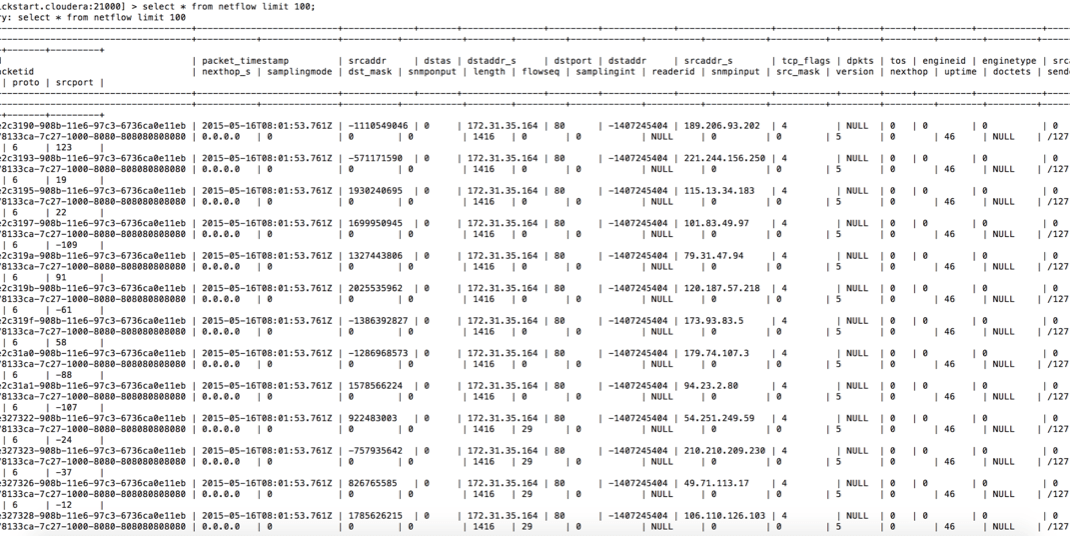
- In the Impala shell, query the
netflowtable to see the data in Kudu:
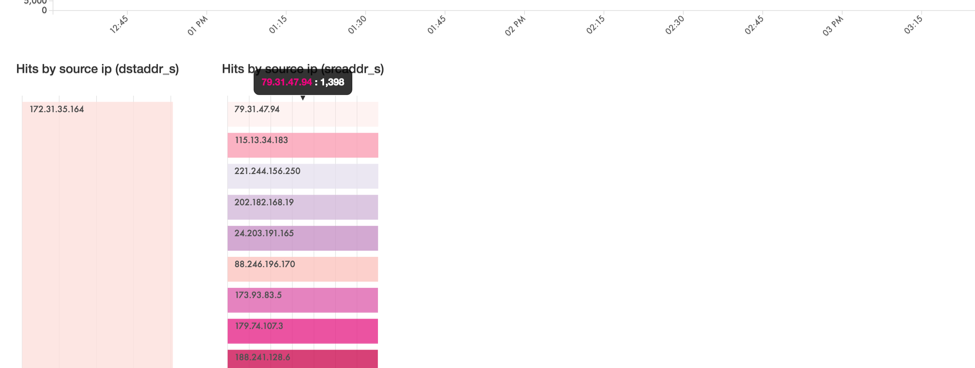
Impala-Kudu to D3 Visualization
This is a small custom visualization which shows the source IP and destination IP along with the time interval. The visualization is colored based on the number of packets the source system sent to the destination system.
- Since D3 is a JavaScript visualization library, you’ll need to serve a page from a web server. Execute the following commands to download the visualization code and start the server. Note that you will need Maven to be installed on your machine
-
$ git clone https://github.com/phdata/network-traffic-visualization.git
$ cd code/app-dataviz-from-impala
$ mvn spring-boot:run
On starting the server, navigate to http://localhost:1990/timetravel.html on your favorite browser, and admire the beauty of these real-time NetFlow IP communication visualizations.
Conclusion
StreamSets Data Collector allows you to easily move NetFlow data from UDP to Apache Kafka to Apache Kudu for analysis. Kafka provides an intermediate message buffer, while Kudu provides both real-time inserts and fast analytics. Download SDC today and build your first pipeline!