In a 2013 Ted Talk, Dr. Kirk Borne, a data scientist and astrophysicist, spoke about the presence of known knowns, known unknowns, and unknown unknowns. Dr. Borne described them like this:
- Known knowns: Things you know about already.
- Known unknowns: New examples of things you know about already.
- Unknown unknowns: Things we can discover that we know nothing about.
Dr. Borne spoke about this concept in the context of data mining. But, depending on the maturity of your organization, there’s another set of known unknowns and unknown unknowns lurking in your data ecosystem.
And it can only be solved at scale with data observability tools.
Defining and Disambiguating Data Observability
Because “observability” means different things in different contexts, it’s essential to first define what we mean when we say data observability.
Data observability is about monitoring data as it moves through a system. This includes monitoring data accuracy, reliability, and accessibility of data for analysis and decision-making.
Data observability done well means you know what data you have, where it’s coming from, when it entered the system, how it’s being processed, and who has access to it. It also means your system will alert you when any of that changes.
Observability in the context of software engineering, machine learning, or IT focuses less on data and more on the behavior of a system as a whole. In this context, it can include data observability but generally encompasses a broader scope, such as monitoring application performance, network traffic, system logs, and more.
How Data Observability Became Mandatory
One of the leaders in data observability, Barr Moses, CEO of Monte Carlo, popularized the concept of data downtime. She explains data downtime like this:
“Data downtime — periods of time when data is partial, erroneous, missing, or otherwise inaccurate — only multiplies as data systems become increasingly complex, supporting an endless ecosystem of sources and consumers.”
As Moses says, data downtime multiplies as the complexity of data systems increases. Just as importantly, the cost of data downtime multiplies as the value of high-quality, accurate data increases.
Put another way, data downtime multiplies as a function of the five V’s of data: volume, variety, velocity, veracity, and value. As these variables increase, so does the potential for the known unknowns and the unknown unknowns that impact data quality, availability, and accuracy.
By helping you know what data you have, where it’s coming from, when it entered the system, how it’s being processed, and who has access to it, data observability helps you turn both known and unknown unknowns into known knowns.
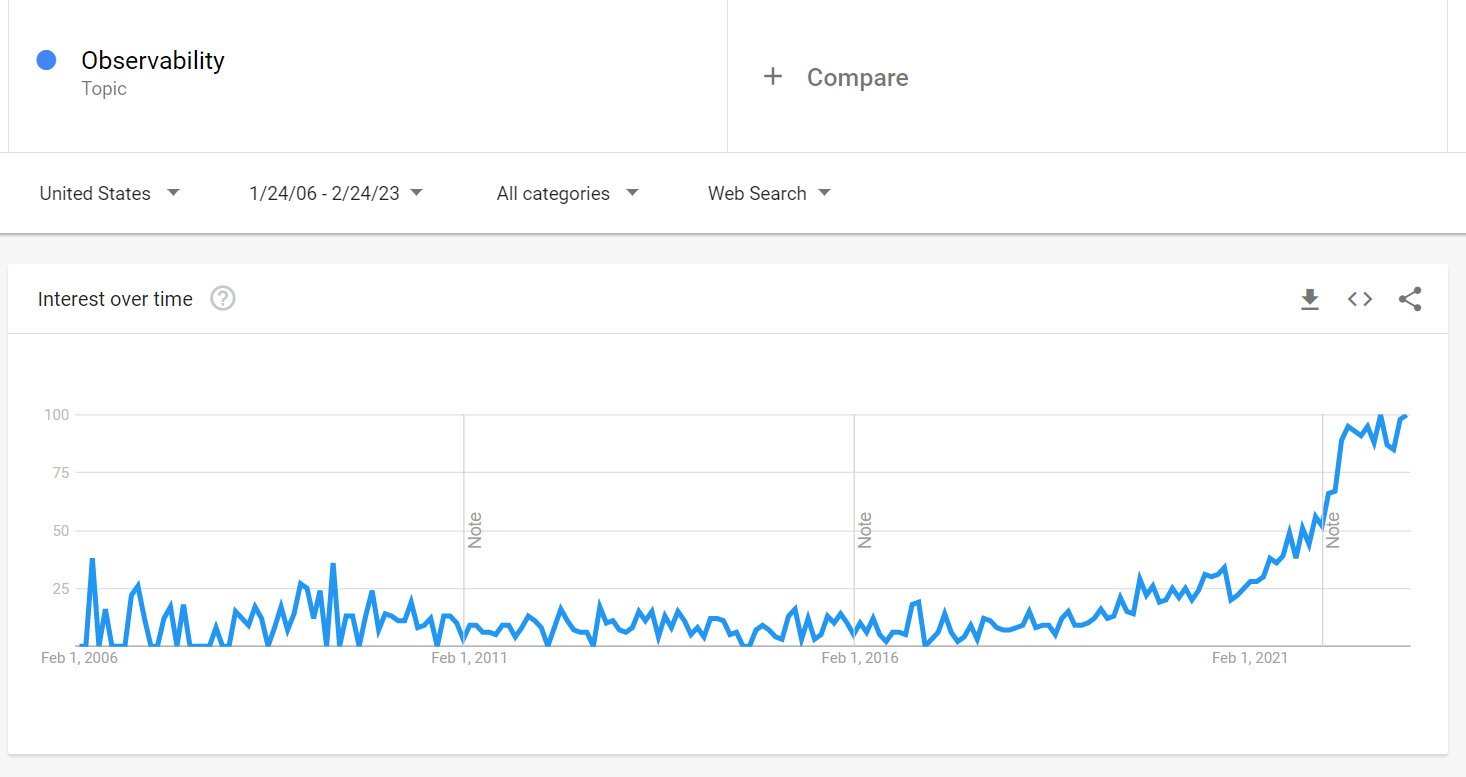
That is why data observability is mandatory, which is further borne out by the chart below, showing a huge increase in interest in observability.
What Data Observability Tools Are — and Aren’t
Data observability tools are built for data teams and, more specifically, data engineers. The tools’ ultimate goal is to reduce instances of incorrect data. These tools monitor data volume, schema, distribution, and freshness.
You’ll typically use data observability tools to:
- Visualize dependencies
- Analyze metadata
- Identify and address issues
Data observability tools interface and are often confused with other tools such as data monitoring, testing, and quality tools.
The difference between data observability tools and data quality and testing tools is that data observability is a broader concept. Data quality tools assess data quality by evaluating it against rules. Similarly, data testing tools verify the accuracy of data by running tests against it.
These functions may be included in the data observability platform but wouldn’t constitute data observability on their own.
Data Observability vs. Data Monitoring
Data monitoring is the process of tracking data in real-time and raising alerts when issues arise. Data observability provides a more comprehensive view of data system performance and health. Data observability encompasses data monitoring but goes beyond it by focusing on understanding and troubleshooting issues.
Whereas data monitoring tools help you find issues, data observability solutions help you fix them.
The Pillars of Data Observability
The five pillars of data observability provide further scaffolding for understanding data observability as well as where it interfaces with its complementary functions.
- Freshness: When was the data generated? When was it generated last?
- Distribution: Is the data within the accepted data range and complete?
- Volume: Do the expected and actual amounts of data match?
- Schema: What is the schema? What was the schema? If it changed, why?
- Lineage: What are the data and user dependencies of this data?
Returning to our discussion on complementary functions, you can see how other tools may answer certain questions. But it’s data observability tools that synthesize all the answers to these questions into actionable intelligence.
A Practical Example of Data Observability in Action
Consider a large hospital responsible for managing and analyzing large volumes of patient data.
One day, the hospital notices its data pipeline for patient admissions is delayed, resulting in slower processing times and ultimately impacting patient care. With data observability tools, the hospital can quickly identify the root cause, a software bug in the patient admission application causing data to be processed incorrectly.
Diving into this example further, we can see the spectrum of success on which data observability lives.
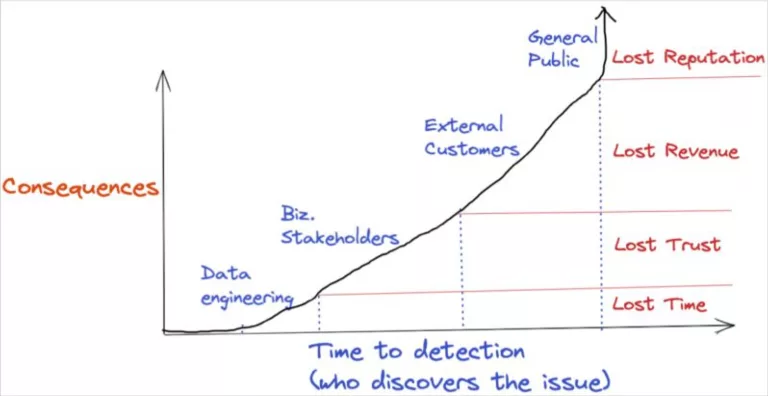
Consider what we don’t know from this example: Who notices the issue? And how does that impact the cost of the issue?
The best case (i.e., the least costly) is that the data engineering team notices and remediates the delay. Less ideal is that a hospital clerk notices the delay.
Costlier than that, many patients “notice” the issue because they’re left waiting with no answers. And the worst-case scenario is that the situation spirals to the point that the general public finds out.
Monte Carlo Data provides a great visualization of this concept below:
Key Takeaways: Data Observability and Related Concepts
-
Data Observability Defined
Data observability is about monitoring data and its relationships as it moves through a system. This includes monitoring data accuracy, reliability, and accessibility of data for analysis and decision-making.
-
The Pillars of Data Observability
The Five Pillars of Data Observability represent the questions answered by data observability and include freshness, distribution, volume, schema, and lineage.
-
What Success Looks Like
You know you’re doing data observability well when you’re able to proactively address issues with data accuracy, reliability, and accessibility.
-
Why Data Observability Matters
Data downtime multiplies as a function of the five V’s of data: volume, variety, velocity, veracity, and value. In the modern data stack, the five V’s of data will undoubtedly continue to increase, which means, as imperative as data observability is now, it will be more important in the future.
To learn more about different but related concepts that can help you understand data observability, read our free resources on data lineage and data governance.
StreamSets and Data Observability Tools
Data Observability platforms like Monte Carlo and Bigeye can share a close relationship to StreamSets. Data visibility is key to understanding data, and understanding data is the first step in data pipeline creation. You have to know what the original state of the data is, in order to craft a successful pipeline to change that state in a fundamental way. This is where the relationship between data observability platforms and StreamSets begins.
In addition, you can potentially configure StreamSets Data Collector to export and send metadata automatically to data observability tools once a pipeline stops..
You could then potentially use your preferred data observability tool to explore metadata around your pipeline and view data lineage diagrams. Plus, the impact on your running pipeline threads is minimal.
To see how StreamSets can help you facilitate the data observability your organization needs, request a demo today.